Compliance Just Got Easier: Stay ahead of regulatory changes with instant notifications on updates that matter.
['Air Programs']
['Greenhouse Gases']
2021-11-09T06:00:00Z
JOIN TODAY TO CONTINUE READING THIS ARTICLE & OTHER INDUSTRY NEWS!
You'll also get exclusive access to:
A database of easy-to-understand regulationsAsk unlimited questions to our expertsPre-led discussions forumsAnd more
TRY IT FREE TODAY
Already have an account? Log in now.

Copyright 2026 J. J. Keller & Associate, Inc. For re-use options please contact copyright@jjkeller.com or call 800-558-5011.
NewsGreenhouse GasesIndustry NewsIndustry NewsCAA ComplianceEnvironmentalFocus AreaEnglishAir ProgramsUSA
2020 greenhouse gas reporting data showed continued downward trend
2021-11-09T06:00:00Z
Data collected by EPA’s Greenhouse Gas Reporting Program (GHGRP) shows that reported greenhouse gas (GHG) emissions from large industrial sources in 2020 were approximately 9% lower than the previous year.
While the decrease in GHG emissions is reflective of long-term industry trends, it is also due in part to the economic slowdown caused by the COVID-19 pandemic. It marks the eleventh year of data collection for most sectors under the GHGRP, which gathers information on direct emissions of GHGs from the largest stationary sources in the United States. This represents approximately half of total U.S. emissions and includes major industrial sources including power plants, landfills, iron and steel mills, and oil and gas production.
More than 8,100 large facilities reported emissions to the GHGRP in 2020, and EPA highlighted several points gleaned from the data:
- Power plants were the largest stationary source of GHG emissions in the U.S. in 2020, with 1,339 facilities emitting about 1.5 billion metric tons of carbon dioxide. This represents a 10% decline between 2019 and 2020, and a 33% decline since 2011.
- Petroleum and natural gas systems were the second largest stationary source of emissions with a reported total of 316 million metric tons of GHG emissions. This represents a 9% decline from 2019 totals, but a 11.6% increase since 2016, the first year that included comparable data for this sector.
- Large sources in the industrial and waste sectors reported a combined 2,286 million metric tons of GHG emissions in 2020, a decline of 8.9% from 2019 and a decline of 26% since 2011. Emissions reductions were reported in all sectors, with the largest reductions in the metals, oil and gas, and refineries sectors. EPA notes this reflects a reduced demand for vehicles and gasoline amid COVID-19.
In addition to releasing the 2020 GHG reporting data, the GHGRP also noted the addition of a demographic mapping layer to EPA’s online tool for presenting the data. Called the Facility Level Information on Greenhouse gases Tool (FLIGHT), this mapping layer uses census tract information drawn from EPA’s EJSCREEN environmental justice screening and mapping tool. GHGRP is also releasing a dashboard of interactive maps, graphs, and charts to allow greater insight into demographics of communities potentially impacted by reporting facilities.
Key to remember: EPA data demonstrates a continued downward trend in GHG emissions across the U.S., and the agency’s Greenhouse Gas Reporting Program is releasing new mapping and demographics tools alongside publication of the data to provide additional insights and analysis.


See More
RELATED NEWS


Specialized Industries
Go beyond the regulations! Visit the Institute for in-depth guidance on a wide range of compliance subjects in safety and health, transportation, environment, and human resources.
J. J. Keller® COMPLIANCE NETWORK is a premier online safety and compliance community, offering members exclusive access to timely regulatory content in workplace safety (OSHA), transportation (DOT), environment (EPA), and human resources (DOL).

Interact With Our Compliance Experts
Puzzled by a regulatory question or issue? Let our renowned experts provide the answers and get your business on track to full compliance!

Upcoming Events
Reference the Compliance Network Safety Calendar to keep track of upcoming safety and compliance events. Browse by industry or search by keyword to see relevant dates and observances, including national safety months, compliance deadlines, and more.

SAFETY & COMPLIANCE NEWS
Keep up with the latest regulatory developments from OSHA, DOT, EPA, DOL, and more.


REGSENSE® REGULATORY REFERENCE
Explore a comprehensive database of word-for-word regulations on a wide range of compliance topics, with simplified explanations and best practices advice from our experts.

THE J. J. KELLER INSTITUTE
The Institute is your destination for in-depth content on 120+ compliance subjects. Discover articles, videos, and interactive exercises that will strengthen your understanding of regulatory concepts relevant to your business.


ADD HAZMAT, ENVIRONMENTAL, & HR RESOURCES
Unlock exclusive content offering expert insights into hazmat, environmental, and human resources compliance with a COMPLIANCE NETWORK EDGE membership.

DIRECT ACCESS TO COMPLIANCE EXPERTS
Struggling with a compliance challenge? Get the solution from our in-house team of experts! You can submit a question to our experts by email, set up a phone or video call, or request a detailed research report.


EVENTS
Register to attend live online events hosted by our experts. These webcasts and virtual conferences feature engaging discussions on important compliance topics in a casual, knowledge-sharing environment.
Most Recent Highlights In Environmental

NewsIndustry NewsEnglishEnvironmental Management SystemsISO 14001Environmental Management SystemsEnvironmentalIn-Depth ArticleLifecycle AnalysisEnvironmental Management SystemsFocus AreaUSA
2026-07-14T05:00:00Z
ISO 14001:2026 arrives: Key changes for environmental management systems
Environmental management has changed significantly since ISO 14001 was last revised in 2015. Climate-related risks, resource constraints, supply chain challenges, and stakeholder expectations have reshaped how organizations manage environmental issues. In response, the International Organization for Standardization (ISO) released ISO 14001:2026, the first major update to the environmental management system (EMS) standard in over a decade.
The revised standard doesn't change the purpose of ISO 14001. Organizations will continue to use an EMS to identify environmental aspects, meet compliance obligations, manage environmental risks, and improve environmental performance. However, the new edition clarifies requirements and places greater emphasis on measurable environmental results. ISO says the revision is intended to better align EMS programs with today's environmental challenges. Organizations certified to ISO 14001 may need to update procedures, documentation, audits, and management reviews.
Why was the standard updated?
When ISO published ISO 14001:2015, many organizations focused primarily on regulatory compliance. While compliance remains a core component of an EMS, environmental managers today face a broader range of issues. Climate impacts, resource availability, supply chain disruptions, and stakeholder expectations can all affect environmental planning and performance. Rather than creating an entirely new framework, the 2026 version largely builds on concepts that already existed in the 2015 edition while expanding and clarifying expectations.
Environmental context receives greater attention
A major theme of the revision is a stronger focus on organizational context. Organizations are expected to look beyond day-to-day compliance activities when identifying environmental risks and opportunities.
The revised standard emphasizes consideration of environmental conditions that may affect the EMS, including climate-related concerns, biodiversity, ecosystem impacts, and natural resource availability. Organizations are expected to evaluate how external issues and stakeholder expectations may influence environmental objectives and planning.
For environmental managers, this may mean expanding annual EMS reviews to evaluate emerging environmental issues that could affect operations, compliance obligations, permit conditions, or environmental objectives.
Change management moves into the spotlight
The revised standard also introduces a more structured approach to managing change. Many organizations already evaluate environmental impacts when making operational changes, but those reviews are often informal.
ISO 14001:2026 expects organizations to plan, manage, and evaluate changes that may affect environmental performance. Examples include:
- Installing new equipment,
- Expanding production capacity,
- Changing raw materials,
- Modifying waste management practices,
- Switching suppliers, and
- Adding new products or processes.
This requirement should sound familiar to many environmental professionals. Operational changes can affect air emissions, waste generation, wastewater discharges, stormwater exposure, and permit applicability. A structured review process can help identify environmental impacts before changes are implemented.
Lifecycle thinking and supply chains gain importance
Lifecycle thinking was already part of ISO 14001:2015, but the revised standard places greater emphasis on it. Organizations are expected to consider environmental impacts throughout the lifecycle of products and services, including activities involving suppliers, contractors, and externally provided products and services.
This requirement doesn't mean organizations are responsible for every environmental impact within their supply chain. Rather, it encourages organizations to understand how purchasing decisions, outsourced activities, and supplier relationships may affect environmental performance.
For some organizations, this could mean greater emphasis on supplier evaluations, procurement procedures, contractor oversight, or product stewardship initiatives.
Leadership involvement becomes more visible
ISO 14001:2026 also strengthens expectations related to leadership accountability. Environmental management is no longer viewed solely as the responsibility of the environmental department.
The revised standard emphasizes visible leadership involvement and broader organizational participation. Environmental responsibilities may extend beyond EHS personnel to departments such as operations, purchasing, engineering, and management. Organizations will need to demonstrate that leadership is actively engaged in environmental planning, resource allocation, and performance evaluation activities.
What should organizations do now?
Although organizations have time to prepare for the transition, environmental managers may want to begin evaluating their programs now. Early reviews can help identify gaps and reduce the likelihood of surprises during future audits.
Questions organizations may want to consider include:
- Does the EMS adequately address climate, resources, and other emerging environmental issues?
- Is there a documented process for evaluating environmental impacts before operational changes are made?
- Are lifecycle considerations incorporated into purchasing and contractor management activities?
- Can leadership involvement be demonstrated through documented actions and decisions?
- Do environmental objectives show measurable performance improvements?
While ISO 14001:2026 is an evolution of the existing standard rather than a complete overhaul, organizations shouldn't assume existing EMS procedures will meet the revised expectations. Environmental managers may want to review how their systems address organizational context, change management, lifecycle considerations, and leadership involvement before their next audit.
Key to remember: For environmental professionals, the revised standard provides an opportunity to strengthen that connection and demonstrate the value that effective environmental management brings to the organization.

NewsWasteTSCA ComplianceWater ProgramsEnvironmental Protection Agency (EPA)CAA ComplianceWater ProgramsCWA ComplianceWaste/HazWasteEnglishAir ProgramsIndustry NewsIndustry NewsWasteEnvironmentalFocus AreaSARA ComplianceAir ProgramsUSA
2026-07-09T05:00:00Z
EPA releases 2026 regulatory agenda
The Environmental Protection Agency (EPA) published the 2026 Agenda of Regulatory and Deregulatory Actions on July 3, 2026. The agenda outlines the agency’s upcoming regulatory actions and their status in the rulemaking process. Many of the proposed and final rules support EPA’s continued deregulatory efforts.
Significant rulemaking on EPA’s docket includes the following:
- Proposing risk management regulations under the Toxic Substances Control Act (TSCA) for various chemical substances, such as formaldehyde, diisodecyl phthalate (DIDP), and diisononyl phthalate (DINP);
- Aligning the definition of “waters of the United States” with the Supreme Court’s Sackett v. Environmental Protection Agency (2023) decision, which narrowed the definition under the Clean Water Act;
- Finalizing the part 2 risk management regulations for asbestos, including use and associated disposal requirements for legacy asbestos, asbestos-containing talc, and asbestos fibers other than chrysotile;
- Repealing the Carbon Pollution Standards (CPS) that limit greenhouse gas emissions from fossil fuel-fired plants (or repealing a narrower set of requirements under the CPS); and
- Establishing a federal permitting program under the Resource Conservation and Recovery Act (RCRA) for the disposal of coal combustion residuals (CCR).
Additionally, EPA continues to conduct rulemaking related to per- and polyfluoroalkyl substances (PFAS), such as:
- Revising existing effluent limitations guidelines and standards (ELGs) to address PFAS discharges from PFAS manufacturing facilities and chromium electroplating facilities;
- Extending the compliance deadlines for Maximum Contaminant Levels established by the National Primary Drinking Water Regulations (NPDWRs) for perfluorooctanoic acid (PFOA) and perfluorooctane sulfonic acid (PFOS); and
- Rescinding the NPDWRs for four PFAS.
This article highlights some of the major rules we’re monitoring closely. You can review the entire agenda to learn about all the rulemakings EPA plans to review, propose, and finalize. Please note that the agenda dates are tentative, indicating when the agency seeks to publish the rulemakings in the Federal Register.
| Final Rule Stage | |
| Projected publication date | Title |
| July 2026 | Reconsideration of the Greenhouse Gas Reporting Program |
| August 2026 | 1-Bromopropane (1-BP); Regulation Under the Toxic Substances Control Act (TSCA) |
| October 2026 | Revisions to Standards for the Open Burning/Open Detonation of Waste Explosives |
| October 2026 | Secondary Lead Smelting: National Emissions Standard for Hazardous Air Pollutants (NESHAP) Technology Review and Reconsideration |
| January 2027 | Listing of Specific PFAS as Hazardous Constituents |
| Proposed Rule Stage | |
| Projected publication date of notice of proposed rulemaking | |
| August 2026 | Improving Recycling and Management of Renewable Energy Wastes: Universal Waste Regulations for Solar Panels and Lithium Batteries |
| September 2026 | Effluent Limitations Guidelines and Standards for the Oil and Gas Extraction Category (40 CFR 435 Subpart E) |
| October 2026 | Effluent Limitations Guidelines and Standards for the Centralized Waste Treatment Category (40 CFR 437) |
| December 2026 | Clean Water Act Hazardous Substance Facility Response Plans; Amendment Reconsideration |
| December 2026 | National Emission Standards for Hazardous Air Pollutants: Stationary Combustion Turbines; Amendments |
| Pre-Rule Stage | |
| Projected publication date or other action | Title |
| January 2027 (final rule) | Risk Management Program, CAA Section 112(r)(7) (Section 610 Review) |
| August 2026 (begin review) | Oil and Natural Gas Sector: Emission Standards for New, Reconstructed, and Modified Sources (Section 610 Review) |

NewsAir QualityStationary Emission SourcesEnforcement and Audits - OSHAToxic Substances Control Act - EPAAir EmissionsSafe Drinking WaterTSCA ComplianceWater ProgramsWater QualityMonthly Roundup VideoCAA ComplianceAir PermittingHazard CommunicationUSAEnglishHeat StressOSHA Violations and PenaltiesIndustry NewsHeat and Cold ExposureSafety & HealthToxic Substances - EPAGeneral Industry SafetyEnvironmentalFocus AreaWater MonitoringHazard CommunicationAir ProgramsExtreme Temperature PreparationVideo
EHS Monthly Round Up - June 2026
In this June 2026 roundup video, we'll review the most impactful environmental health and safety news.
Hi everyone! Welcome to the monthly news roundup video, where we’ll review the most impactful environmental health and safety news. Let’s take a look at what happened over the past month.
OSHA won’t increase its penalty amounts in 2026. The agency is required to annually adjust its penalties for inflation, based specifically on the October Consumer Price Index data released by the Bureau of Labor Statistics. Due to a lapse in funding, BLS did not release the October 2025 data. Because no alternative calculation is allowed, OSHA penalties will remain at the 2025 amounts.
OSHA updated its inspection guidance for the Hazard Communication standard. While the document is geared towards OSHA inspectors, it provides insights for chemical manufacturers, importers, distributors, and employers as to what the agency will look for during an inspection.
OSHA will hold a series of informal, virtual hearings on multiple proposed rules beginning August 19th. The majority relate to respiratory protection requirements for different chemical substances. All of the proposed rules were originally published in the Federal Register on July 1, 2025.
Nevada OSHA published a list of frequently asked questions related to its recently adopted heat illness rule. The state’s rule took effect April 29.
Turning to environmental news, EPA restored emergency-related affirmative defense provisions for Title V operating permits. This allows stationary sources to assert a regulatory affirmative defense for certain air emission violations caused by events beyond their control.
EPA released two proposed rules that would have major impacts on drinking water regulations for PFAS. The agency will accept comments on the proposals until July 20.
And finally, EPA now allows facilities to submit PCB annual reports electronically. Facilities can start with the upcoming report that’s due July 15.
Thanks for tuning in to the monthly news roundup. We’ll see you next month!

NewsIndustry NewsIndustry NewsPesticidesPesticide Registration and LabelingEnvironmental Protection Agency (EPA)EnvironmentalEnglishFocus AreaPesticidesUSA
2026-07-01T05:00:00Z
EPA sets MyPeST compliance reporting deadlines for bilingual pesticide labeling requirements
The Environmental Protection Agency (EPA) published instructions and deadlines for pesticide registrants to report compliance with bilingual labeling requirements in the MyPeST application. The first compliance reporting deadline is July 31, 2026, for pesticide products with the highest toxicity.
Who’s impacted?
Compliance reporting applies to registrants of pesticide products subject to the bilingual labeling requirements established by the Pesticide Registration Improvement Act of 2022 (PRIA 5) amendments to the Federal Insecticide, Fungicide, and Rodenticide Act (FIFRA).
PRIA 5 requires all end-use pesticide product labels to provide Spanish translations of the human health and safety sections by including the translated sections directly on the label or providing a link via scannable technology or other readily accessible electronic methods to the translated sections. EPA allows certain antimicrobial and non-agricultural pesticide products to comply by providing access to Spanish-language Safety Data Sheets instead of direct label translations.
Compliance timelines are based on the type of pesticide and its toxicity category.
What’s required?
Pesticide registrants must report compliance with the PRIA 5 bilingual labeling requirements using EPA’s MyPeST app. The agency recently published detailed reporting instructions in the MyPeST Application User Guide (accessible in the MyPeST app).
EPA also established the following deadlines for reporting compliance in MyPeST:
| Pesticide product type | Bilingual labeling deadline | Compliance reporting deadline |
|---|---|---|
| Restricted use pesticides (RUPs) | December 29, 2025 | July 31, 2026 |
| Non-RUP agricultural products | ||
| Acute Toxicity Category I | December 29, 2025 | July 31, 2026 |
| Acute Toxicity Category II | December 29, 2027 | January 28, 2028 |
| Antimicrobials and non-agricultural products | ||
| Acute Toxicity Category I | December 29, 2026 | January 28, 2027 |
| Acute Toxicity Category II | December 29, 2028 | January 28, 2029 |
| All other pesticide products | December 29, 2030 | January 28, 2031 |

NewsIndustry NewsEnvironmental Protection Agency (EPA)Oil Spill PreventionOil Spill PreventionEnvironmentalIn-Depth ArticleCWA ComplianceEnglishFocus AreaUSA
2026-06-30T05:00:00Z
Secondary containment alternative: Does your oil-filled operational equipment qualify?
Facilities that run like a well-oiled machine often rely on just that — operational equipment that stores and uses oil to function (like hydraulic systems). But wherever oil is stored, there’s always the possibility of a leak, and spilled oil can do serious harm, especially if it reaches water.
That’s where the Environmental Protection Agency’s (EPA’s) Spill Prevention, Control, and Countermeasure (SPCC) rule comes in. Usually, regulated facilities must equip oil-filled operational equipment with general secondary containment, which is designed to temporarily hold discharged oil until it can be properly cleaned up. However, some facilities may have another compliance option available.
EPA offers an alternative to secondary containment for qualified oil-filled operational equipment. Let’s take a look at the eligibility criteria and what the other method of compliance requires.
What’s oil-filled operational equipment?
EPA defines “oil-filled operational equipment” at 40 CFR 112.2. Generally, it refers to equipment that has one or more oil storage containers with oil that’s used solely to operate the equipment. Common examples are lubrication systems for pumps and compressors, machining coolant systems, circuit breakers, and electrical switches.
Does your facility have qualified equipment?
Only qualified oil-filled operational equipment is eligible for the alternative requirements to general secondary containment.
The SPCC rule considers oil-filled operational equipment to be qualified if it hasn’t had one discharge of oil exceeding 1,000 gallons or two discharges of oil exceeding 42 gallons each over the following time periods:
- If the facility has operated for at least 3 years, within any 12-month period in the 3 years before the SPCC Plan’s certification date; or
- If the facility has operated for less than 3 years, since becoming subject to the SPCC regulations.
Take note! When determining whether your facility’s oil-filled operational equipment is eligible under federal standards:
- Don’t count oil discharges caused by natural disasters, acts of war, or terrorism; and
- Don’t count the total amount of oil spilled, only the amount that reaches navigable waters or adjoining shorelines.
What about oil-filled manufacturing equipment?
The SPCC rule distinguishes between oil-filled manufacturing equipment and oil-filled operational equipment. Oil-filled manufacturing equipment stores oil only as a supporting element for conducting a mechanical or chemical operation to create or modify a product. It typically involves a flow-through process in which oil continuously moves through the equipment. Examples of this type of equipment include reaction vessels, mixing tanks, and distillation columns.
Because it’s defined independently under the SPCC rule, oil-filled manufacturing equipment isn’t eligible for the alternative compliance option available to qualified oil-filled operational equipment.
What are the alternative measures?
Instead of providing secondary containment for qualified oil-filled operational equipment, facilities may choose to comply with the alternative requirements at 112.7(k), which include:
- Establishing and documenting an inspection or a monitoring program to detect equipment failures and discharges; and
- Adding to the SPCC Plan:
- An oil spill contingency plan according to the requirements of Part 109; and
- A written commitment of the resources (manpower, equipment, and materials) needed to quickly control and remove any potentially harmful quantities of discharged oil;
Take note! If your business must submit a facility response plan (FRP) under 112.20, the oil spill contingency plan and written commitment requirements don’t apply since your FRP already contains these elements.
Why should my facility consider the alternative compliance option?
The alternative requirements to general secondary containment don’t require facilities to prepare an impracticability determination for qualified oil-filled operational equipment.
The impracticability determination provisions at 112.7(d) impose more requirements for facilities that use alternative measures to secondary containment for unqualified equipment.
In addition to meeting the same requirements for qualified oil-filled operational equipment, facilities must have the oil spill contingency plan certified by a Professional Engineer (unless self-certifying as a qualified facility). They also must:
- Describe in the SPCC Plan the reasons such measures aren’t practicable, and
- Conduct periodic integrity tests of bulk storage containers and periodic integrity and leak tests of valves and piping.
Key to remember: The SPCC rule offers an alternative to general secondary containment requirements for qualified oil-filled operational equipment.
Most Recent Highlights In Transportation

NewsGreenhouse GasesAir QualityExcavationsToxic Substances Control Act - EPAToxic Subtances Control Act - EPAPersonal Protective EquipmentAir EmissionsTSCA ComplianceExcavationsMonthly Roundup VideoMiningCAA ComplianceUSAEnglishIndustry NewsSafety & HealthConstruction SafetyInfectious DiseasesCOVID-19General Industry SafetyGeneral Duty ClauseSpecialized IndustriesEnvironmentalFocus AreaRespiratory ProtectionMine SafetyGeneral Duty ClauseAir ProgramsVideo
EHS Monthly Round Up - August 2025
In this August 2025 roundup video, we'll review the most impactful environmental health and safety news.
Hi everyone! Welcome to the monthly news roundup video, where we’ll review the most impactful environmental health and safety news. Let’s take a look at what’s happened over the past month!
OSHA extended the comment period for multiple proposed rules it published on July 1. Stakeholders now have an extra 60 days, until November 1, to comment. Impacted rules include those for respiratory protection, construction illumination, COVID-19, and the General Duty Clause.
OSHA is expanding its Voluntary Protection Programs to help employers develop strong safety programs and lower injury rates. To participate, employers must submit an application to OSHA and undergo an onsite evaluation by a team of safety and health professionals.
Following a series of recent trench collapses, OSHA urges employers to take steps to protect workers. Trench collapses can be prevented by sloping or benching trench walls at an angle, shoring trench walls with supports, and shielding walls with trench boxes. More information can be found on OSHA’s website.
The Mine Safety and Health Administration launched a webpage for its new Compliance Assistance in Safety and Health, or CASH, program. The agency anticipates a surge in domestic mining productivity and seeks to proactively provide miners and mine operators with compliance assistance materials.
Turning to environmental news, EPA proposes challenges to California’s Clean Truck Check program. The program aims to reduce emissions of nitrogen oxides and particulate matter for heavy-duty vehicles. EPA supports the regulation as it applies to California-registered vehicles but disapproves the regulation as it applies to out of state and out of country vehicles. Stakeholders have until September 25 to comment on the proposal.
On August 14, EPA released the July 2025 nonconfidential TSCA Inventory of chemical substances manufactured, processed, or imported in the U.S. The Inventory contains over 86 thousand chemicals, nearly half of which are in active use. The next inventory update is planned for late 2026.
And finally, EPA proposes to rescind the 2009 Endangerment Finding and repeal greenhouse gas emissions for new motor vehicles and vehicle engines. The agency will accept comments on the proposal through September 15.
Thanks for tuning in to the monthly news roundup. We’ll see you next month!

NewsHazardous WasteGreenhouse GasesWaste ManifestsWater ProgramsFall ProtectionMonthly Roundup VideoFall Protection for ConstructionCAA ComplianceUSAWater ProgramsWaste/HazWasteEnglishIndustry NewsSafety & HealthConstruction SafetyGeneral Industry SafetyWasteEnvironmentalFocus AreaAir ProgramsVideo
EHS Monthly Round Up - September 2025
In this September 2025 roundup video, we'll review the most impactful environmental health and safety news.
Hi everyone! Welcome to the monthly news roundup video, where we’ll review the most impactful environmental health and safety news. Let’s take a look at what’s happened over the past month.
OSHA released its Spring 2025 regulatory agenda on September 4. Many rulemakings have been pushed into the fourth quarter of 2025 and the first half of 2026, while a few have been removed from the agenda altogether. These include Infectious Diseases, Blood Lead Level for Medical Removal, and the Musculoskeletal Disorders Column on the OSHA 300 log.
Three rules moved into the long-term actions category – Workplace Violence in Health Care and Social Assistance, Cranes and Derricks in Construction, and Process Safety Management and Prevention of Major Chemical Accidents. The proposed rule stage saw an influx of new entries, most of which were published in the July 1 Federal Register.
The Standards Improvement Project, slated for proposal in May 2026, intends to “remove, modernize, or narrow duplicative, unnecessary, or overly burdensome regulatory provisions.”
OSHA renewed its alliance with the National Waste and Recycling Association and the Solid Waste Association of North America. The partnership will focus on safety issues such as transportation hazards; slips, trips, and falls; needlestick and musculoskeletal injuries; and health issues associated with lithium battery hazards in waste/recycling collection and processing.
For the 15th year in a row, fall protection for construction topped OSHA’s list of top 10 violations. In fiscal year 2024, there were 5,914 recorded fall protection violations, down from 7,271 in fiscal year 2023. The standards that round out the top 10 remain unchanged, with a shift in some of the rankings.
Turning to environmental news, EPA proposes to eliminate the Greenhouse Gas Reporting Program requirements for all source categories except the petroleum and natural gas systems category. The agency also proposes to suspend compliance obligations for covered facilities until 2034. A public hearing was held October 1 and stakeholders have until November 3 to comment on the proposal.
Hazardous waste handlers may continue to use 5-paper copy manifest forms. EPA announced it will accept these forms from entities regulated by the Resource Conservation and Recovery Act, or RCRA, until further notice. The agency will give a 90-day notice before it plans to stop accepting the 5-copy forms.
And finally, EPA published its Spring 2025 regulatory agenda on September 4. The agenda outlines the agency’s upcoming regulatory actions and their status in the rulemaking process. Major updates on the docket include those for greenhouse gases, risk management rules, and the Renewable Fuel Standards for 2026 and 2027.
Thanks for tuning in to the monthly news roundup. We’ll see you next month!

NewsHazardous WasteEnforcement and Audits - OSHAToxic Substances Control Act - EPAToxic Subtances Control Act - EPAElectronic Reporting of Injury and Illness RecordsTSCA ComplianceMonthly Roundup VideoCAA ComplianceUSAInjury and Illness RecordkeepingWaste/HazWasteEnglishOSHA Violations and PenaltiesIndustry NewsCrystalline SilicaWaste HandlersSafety & HealthGeneral Industry SafetyWasteWaste TransportersEnvironmentalFocus AreaToxic and Hazardous Substances - OSHAVideo
EHS Monthly Round Up - January 2025
In this January 2025 monthly roundup video, we'll review the most impactful environmental health and safety news.
Hi everyone! Welcome to the monthly news roundup video, where we’ll review the most impactful environmental health and safety news. There’s a lot going on, so let’s get started!
As happens at the start of most incoming presidential administrations, a freeze has been placed on all regulatory activity at the federal level, giving the new administration time to review agencies’ plans. The Office of Management and Budget, which must approve most rulemaking activities, has sent numerous pending rules back to the agencies for review. In addition, OSHA withdrew its infectious diseases proposed rule and its COVID-19 in healthcare rule prior to the inauguration.
OSHA’s penalties increased on January 15. The maximum penalty amounts for serious and other-than-serious violations increased to $16,550. For willful or repeated violations, the maximum penalty increased to $165,514 per violation.
OSHA updated its directive on injury and illness recordkeeping policies and procedures. While it’s intended for OSHA compliance officers, employers can use the information to help with recordkeeping compliance.
Fewer workers died on the job in 2023, as fatal work injuries decreased 3.7 percent from 2022. Transportation incidents remained the most frequent type of fatal event, accounting for over 36 percent of all occupational fatalities.
California’s Occupational Safety and Health Standards Board voted to adopt a permanent silica standard. If approved, it would extend and strengthen the state’s emergency temporary standard, which was put in place in December 2023.
The National Institute for Occupational Safety and Health updated its List of Hazardous Drugs in Healthcare Settings. This is a resource for employers and employees in identifying drugs that are hazardous to the health and safety of those who handle them.
Turning to environmental news, EPA released the biannual update of the nonconfidential TSCA inventory. The inventory helps facilities determine their regulatory requirements for the chemicals they use or plan to use.
And finally, EPA added new Management Method Codes to describe how hazardous waste will be managed after temporary storage and transfer. As of January 1st, hazardous waste handlers must use the codes on the Biennial Report Waste Generation and Management forms.
Thanks for tuning in to the monthly news roundup. We’ll see you next month!

NewsProcess Safety ManagementEnforcement and Audits - OSHAToxic Substances Control Act - EPAWasteErgonomicsMonthly Roundup VideoUSAWaste/HazWasteEnglishErgonomicsIndustry NewsEnforcement and Audits - OSHASafety & HealthToxic Substances - EPAGeneral Industry SafetyWasteEnvironmentalHazardous Materials Safety - OSHAFocus AreaVideo
EHS Monthly Round-Up - August 2024
In this August 2024 roundup, we'll review the most impactful environmental, health, and safety news.
Hi everyone! Welcome to the monthly news roundup video, where we’ll review the most impactful environmental, health, and safety news. Please view the content links in the transcript for more information about the topics I’ll be covering today. Let’s get started!
Two State Plan agencies allegedly provided advance notice of workplace inspections to employers, a practice that’s prohibited under the Occupational Safety and Health Act. Now, lawmakers have requested that the Department of Labor’s acting secretary address the allegations and explain what challenges OSHA faces when monitoring and enforcing State Plan compliance.
A recent study shows jobs in agriculture, forestry, fishing, and hunting are among California’s most dangerous, accounting for the highest number of fatalities among full-time workers. Transportation and utilities jobs ranked second and construction was third.
Remote isolation of process equipment can quickly stop the release of hazardous materials, which can help prevent fatalities and injuries, limit facility damage, and better protect communities and the environment. A U.S. Chemical Safety Board study explores their use and makes recommendations for their utilization in chemical facilities.
A National Safety Council report explores the role of diversity, equity, and inclusion on work-related musculoskeletal disorders, or MSDs. MSDs are the most common workplace injury and often lead to worker disability, early retirement, and employment limitations.
And finally, turning to environmental news, EPA published a final rule that revises its hazardous waste export manifest regulations. All hazardous waste shipments and manifest-related reports will be managed electronically through the agency’s e-Manifest program.
Thanks for tuning in to the monthly news roundup. We’ll see you next month!
NewsIndustry NewsEnglishIn-Depth ArticleCAA ComplianceSustainabilityEnvironmental Management SystemsCWA ComplianceEnvironmentalWaste/HazWasteSustainabilityESG (Environmental, Social, and Governance)Focus AreaUSA
2026-06-26T05:00:00Z
Multimedia inspections are back: How to prepare for comprehensive EPA and state audits
Regulators have returned to routine, in-person inspections, and many are no longer limited to a single program. The Environmental Protection Agency (EPA) and state agencies are again conducting multimedia inspections that review air, water, and hazardous waste compliance in one visit. For facilities, this shift raises the stakes. An issue in one program can quickly lead inspectors into others, especially when records or operations don't align.
Most inspectors now arrive with background data already reviewed. Electronic submissions, air reports, discharge monitoring reports, and hazardous waste filings are compared against what they see on-site. When numbers, dates, or practices don't match, the scope of the inspection often expands.
What inspectors are really evaluating
While documents are important, inspectors focus on whether procedures match actual operations. They will often start with a walk-through of the facility, tracing how materials move through production and become emissions, discharges, or wastes.
For example:
- Air compliance may be checked by reviewing fuel use, hours of operation, or control device logs;
- Stormwater compliance often involves visual checks for exposed materials and conditions of controls; and
- Hazardous waste inspections typically focus on labeling, container condition, and accumulation practices.
The common thread is consistency. If a plan says one thing but operators do another, it's likely to result in a finding.
Common gaps seen during multimedia inspections
Across industries, several issues appear repeatedly:
- Records that don't match across programs (e.g., waste logs versus manifests);
- Missing or incomplete inspection logs for air or stormwater systems;
- Assumptions about exemptions without supporting documentation;
- Satellite accumulation areas managed informally outside environmental oversight; and
- Housekeeping issues that create unintended stormwater exposure.
Many of these aren't complex violations. They're breakdowns in communication, training, or follow-through.
A practical way to prepare
Facilities can improve readiness by conducting an internal, cross-media review that mirrors an actual inspection. This is more effective than reviewing each program in isolation.
Start with a process-based walk-through:
- Identify where raw materials enter the facility.
- Follow how they're used, stored, and handled.
- Note where wastes, emissions, or discharges are generated.
- Confirm how each is managed and documented.
At each step, ask two questions:
- Is this activity reflected accurately in our records and plans?
- Would an operator explain it the same way it's written?
This approach often reveals gaps that aren't obvious during a desk review.
A recent case: How one issue expands the scope
At a mid-sized manufacturing facility, inspectors began with a routine hazardous waste review. They noticed that waste logs showed periodic disposal of solvent residues, but there were no related air records for emissions tied to cleaning operations.
This led inspectors to review the facility’s air permit assumptions. They found that solvent use had increased over time, but the facility hadn't updated its potential-to-emit calculations. What started as a simple waste review expanded into an air applicability concern.
The facility ultimately faced findings in both programs, not because of a single major violation, but because information didn't align across systems.
Strengthening compliance across programs
Preparation doesn't require building new systems. It requires making sure existing ones are aligned and consistently followed.
Focus on:
- Clear ownership of compliance tasks across departments;
- Regular cross-checks between records (air, water, waste);
- Training staff on how their daily tasks affect compliance; and
- Maintaining documentation that supports assumptions, exemptions, and limits.
Facilities that treat compliance as a connected system, not separate programs, are better positioned during inspections.
Key to remember: A multimedia inspection looks for consistency across air, water, and waste programs, not just isolated compliance. If your records and operations tell the same story, you're far less likely to face expanded scrutiny.
Most Recent Highlights In Safety & Health
NewsHazardous WasteIndustry NewsWaste GeneratorsEnglishWasteEnvironmentalIn-Depth ArticleWaste/HazWasteFocus AreaUSA
2026-06-25T05:00:00Z
Hazardous waste episodic events: What to do when a bad month happens
Every generator has that month. A tank clean-out gets scheduled; a forklift punctures a tote, and suddenly you've generated way more hazardous waste than you normally would. If you're a Very Small Quantity Generator (VSQG) or Small Quantity Generator (SQG), that one bad month could technically bump you into Large Quantity Generator (LQG) status, potentially subjecting the facility to LQG requirements such as contingency planning, personnel training, and biennial reporting.
The good news is that EPA built in an escape hatch. The 2016 Generator Improvements Rule added 40 CFR Part 262, Subpart L (the "episodic event" provision), which lets you keep your normal generator category for that month, if you follow the rules in 40 CFR 262.232 exactly.
Scenario 1: The planned tank clean-out
Picture a metal finishing shop that's normally an SQG, generating about 400 kg/month of spent plating solution. They finally get around to cleaning out an old process tank that's been sitting idle for three years. That clean-out produces about 1,800 kg of sludge in one shot and enough to push them into LQG numbers for the month.
Since this is something the facility planned and scheduled for, it's a planned episodic event. Here's what the employer would need to do:
- Notify EPA (or the delegated state agency) at least 30 calendar days before the clean-out starts, using EPA Form 8700-12. Include the start/end dates, why the event is happening, estimated waste types and quantities, and a 24-hour emergency contact.
- Double-check the facility's EPA ID number to make sure it is current.
- Stage the waste properly with compliant containers or tanks and labeled with the episodic event start date.
- Get it manifested and shipped off-site within 60 calendar days of the start date.
- Hang onto every record including the notification, manifests for 3 years after the event ends.
Scenario 2: The unplanned spill
Next, picture a packaging plant. They are a VSQG generating around 80 kg/month. They have a forklift punch a hole in a 275-gallon tote of listed solvent and by the time cleanup is done, they're looking at about 900 kg of contaminated absorbent and solvent residue. Nobody planned this. It's not part of normal operations. That makes it an unplanned episodic event. Here is what they should do:
- They have 72 hours to notify EPA or the state by phone, email, or fax. There will be no time to fill out paperwork first.
- Follow that up by submitting EPA Form 8700-12 after the fact, documenting what happened since you couldn't give advance notice.
- Keep the spill cleanup waste separate from your routine waste streams and label it with the episodic start date.
- The same 60-day shipping window and 3-year recordkeeping requirement apply here too.
The things you can't skip
Whether the event is planned or unplanned, there are a handful of conditions that apply across the board and missing any one of them could cost you the episodic event relief entirely.
- One event per year, period. Both VSQGs and SQGs get exactly one episodic event a year unless they petition the Regional Administrator under 40 CFR 262.233 for a second. That second one must be the opposite type, so if your first was planned, the next must be unplanned.
- The clock doesn't wait. Exactly 30 days out for planned and 72 hours for unplanned are required. Miss either window or you lose the relief entirely, meaning full LQG status kicks in for that period.
- The 60-day shipping clock starts on day one of the event, not when you send the notification, so make sure to track it immediately.
- Manifest the waste properly. Episodic waste can ship under the standard Subpart B manifest rules, even in the same load as your regular waste.
- Write everything down. Three years of solid records such as dates, causes of event, quantities, and where it went is what separates a clean inspection from an enforcement headache.
Keys to remember: The episodic event provision rewards generators who plan, classify the event correctly, notify on time, ship within 60 days, and document everything for three years.
NewsGreenhouse GasesAir QualityAir EmissionsChange NoticesChange NoticeVirginiaCAA ComplianceEnvironmentalFocus AreaEnglishAir ProgramsAir Programs
2026-06-24T05:00:00Z
Virginia reinstates power plant CO2 budget program
Effective date: April 24, 2026
This applies to: Power plant owners
Description of change: The Virginia Department of Environmental Quality reinstated the Virginia CO2 Budget Trading Program Regulation, which implements the Regional Greenhouse Gas Initiative (RGGI). Participation in the RGGI was stopped in 2023, but the state will resume participation on July 1, 2026, the same date on which the compliance requirements take effect.
The regulation requires fossil fuel-fired units that serve an electricity generator with a capacity of 25 megawatts or more to obtain enough allowances to cover CO2 emissions, which they can purchase in the September and December RGGI auctions.
The department also adopted amendments to the regulations, including establishing a one-time 6-month control period from July 1, 2026, to December 31, 2026.
Related state info: Clean air operating permits state comparison
NewsMunicipal WastewaterChange NoticesChange NoticeWater ProgramsEnvironmentalCWA ComplianceEnglishFocus AreaNorth Carolina
2026-06-24T05:00:00Z
North Carolina approved revisions to wastewater discharge rules
Effective date: May 1, 2026
This applies to: Facilities with domestic wastewater discharges up to 2 million gallons per day
Description of change: The North Carolina Department of Environmental Quality (DEQ) adopted a rule that adds a permitting option to the National Pollutant Discharge Elimination System (NPDES) program for facilities with domestic wastewater discharges of up to 2 million gallons per day.
DEQ removed the ban on new or expanded discharges of oxygen-consuming waste when the 7Q10 and 30Q2 flows are both 0 for these facilities. In other words, it allows systems to discharge domestic wastewater to zero-flow receiving streams, provided the system:
- Meets qualifying criteria,
- Complies with specific effluent limits, and
- Uses low-energy methods before discharging wastewater to the receiving stream.
It’ll likely benefit areas where the cost of piping to a higher-flowing stream farther away is prohibitive.
NewsGroundwaterSafe Drinking WaterWater ProgramsWater QualityWater ProgramsCWA ComplianceEnglishMunicipal WastewaterWater PermittingChange NoticesChange NoticeWater ReportingIndustrial WastewaterEnvironmentalNew HampshireFocus Area
2026-06-24T05:00:00Z
New Hampshire updates sludge management rules
Effective date: May 15, 2026
This applies to: Owners and operators of drinking water and wastewater treatment plants that generate sludge; land application sites; and facilities that treat, manage, or dispose of sludge
Description of change: The New Hampshire Department of Environmental Services amended sludge management rules. Major changes include:
- Reinstating 5-year site and facility permit renewals (instead of 10 years),
- Adding annual reporting requirements for sludge haulers (which already apply to septage haulers), and
- Requiring all applications to be submitted electronically.
The rule also codifies per- and polyfluoroalkyl substances (PFAS) sampling (implemented in 2019 for the sludge quality certificate program).
NewsGroundwaterToxic/Hazardous Substance ReleasesCERCLA, SARA, EPCRASafe Drinking WaterChange NoticesChange NoticeWater ProgramsNew JerseyEnvironmentalCWA ComplianceEnglishFocus Area
2026-06-24T05:00:00Z
New Jersey adopts permanent remediation standards for PFAS
Effective date: June 15, 2026
This applies to: Contaminated sites subject to the remediation regulations for contaminated groundwater, soil, and soil leachate
Description of change: The New Jersey Department of Environmental Protection (NJDEP) formally adopted its interim remediation standards for specific per- and polyfluoroalkyl substances (PFAS), including:
- Groundwater quality standards for hexafluoropropylene oxide dimer acid and its ammonium salt (GenX chemicals); and
- Soil and soil leachate remediation standards for:
- Perfluorononanoic acid (PFNA);
- Perfluorooctane sulfonate (PFOS);
- Perfluorooctanoic acid (PFOA);
- GenX chemicals; and
- Methanol.
The interim standards have been in place since 2022 and 2023, requiring regulated entities to conduct remediation to ensure these PFAS are cleaned up.
Additionally, the NJDEP amended the technical requirements to mandate analyses of the following chemicals in all media when contaminants are unknown or not well documented at a contaminated site:
- PFNA,
- PFOS,
- PFOA,
- GenX chemicals, and
- 2,3,7,8-tetrachlorodibenzo-p-dioxin.
Most Recent Highlights In Human Resources
NewsHazardous WasteWaste HandlersChange NoticesChange NoticeWasteWaste/HazWasteWaste ManagementEnvironmentalNevadaEnglishFocus Area
2026-06-24T05:00:00Z
Nevada adds requirements for hazardous waste recyclers
Effective date: June 8, 2026
This applies to: Hazardous waste recyclers
Description of change: The State Environmental Commission adopted regulations to add requirements for entities that recycle certain hazardous waste, including compliance with:
- Certain federal requirements;
- Local zoning requirements, if applicable;
- Specific reporting and notification requirements; and
- Other particular regulations of the commission.
The rules also:
- Exempt owners and operators of certain facilities that recycle certain hazardous materials without storing those materials before they’re recycled from the above requirements, and
- Add fees for written determinations (required to construct or operate a facility or mobile unit for hazardous waste recycling) and for the facilities that recycle certain hazardous materials without storing those materials before they’re recycled.
NewsToxic Substances Control Act - EPAChange NoticesChange NoticeTSCA ComplianceToxic Substances - EPACaliforniaEnvironmentalEnglishFocus Area
2026-06-24T05:00:00Z
California adds TPhP nail products to Priority Products list
Effective date: October 1, 2026
This applies to: Nail products containing triphenyl phosphate (TPhP) at concentrations greater than 250 parts per million (ppm)
Description of change: The California Department of Toxic Substances Control added nail products with concentrations of 250 ppm or more of TPhP to the Priority Product list, making the substance subject to the Safer Consumer Products (SCP) Regulations.
By November 30, 2026, manufacturers must submit a Priority Product Notification. By March 30, 2027, manufacturers must submit:
- A Chemical Removal Intent/Confirmation Notification,
- A Product Removal Intent/Confirmation Notification,
- A Product-Chemical Replacement Intent/Confirmation Notification, or
- A Preliminary Alternatives Analysis Report or alternate reporting options.
NewsIndianaSafe Drinking WaterChange NoticesChange NoticeWater ProgramsEnvironmentalCWA ComplianceEnglishUnderground Injection ControlFocus Area
2026-06-24T05:00:00Z
Indiana adds permanent underground carbon dioxide storage rules
Effective date: June 10, 2026
This applies to: Entities that seek to participate in carbon sequestration projects
Description of change: The Natural Resources Commission adopted rules for permanent underground carbon dioxide storage, establishing:
- The rules for entities seeking to petition the Indiana Department of Natural Resources to issue involuntary integration orders for pore spaces, and
- The rules for storage operators seeking to apply for certificates of project completion.
These regulations add options for entities; the requirements apply only if the options are utilized.
The rules impact entities seeking to participate in carbon sequestration projects. The regulations also affect pore space owners and surface owners.
NewsTier II Inventory ReportingIndustry NewsIndustry NewsCERCLA, SARA, EPCRAEnvironmental Protection Agency (EPA)Safety Data Sheet ReportingEnvironmentalEnglishSARA ComplianceFocus AreaUSA
2026-06-24T05:00:00Z
EPA aligns EPCRA rules with OSHA’s HazCom amendments
The Environmental Protection Agency (EPA) published a final rule on June 22, 2026, conforming the hazardous chemical inventory reporting regulations under the Emergency Planning and Community Right-to-Know Act (EPCRA) to the Occupational Safety and Health Administration’s (OSHA’s) Hazardous Communication (HazCom) standard amendments of 2012 and 2024.
Who’s covered?
The final rule applies to facilities regulated under EPCRA Sections 311 and 312. These facilities are:
- Required by OSHA’s HazCom standard to maintain Safety Data Sheets (SDSs) for hazardous chemicals on-site at or above the reporting threshold, and
- Required by EPA’s EPCRA Section 312 rules (40 CFR Part 370) to submit annual hazardous chemical inventory reports (commonly known as Tier II reports) for the same chemicals by March 1.
Covered facilities submit SDSs and annual inventory reports to the State Emergency Response Commission (SERC), Local Emergency Planning Committee (LEPC), and local fire department.
How does this impact facilities?
EPA’s final rule replaces the previous EPCRA hazard categories with OSHA’s GHS-aligned hazard classes and hazard categories (totaling 118), which are already used in SDSs. Facilities must use OSHA’s hazard classes with their categories for SDS submissions and hazardous chemical inventory reports required under EPCRA Sections 311 and 312.
Note: SDSs for substances already contain the updated hazard classes and hazard categories. SDSs for mixtures must incorporate them by November 2027.
What’s the compliance timeline?
Covered facilities must use the new hazard categories by January 1, 2028. EPA expects facilities to incorporate them into the reporting year 2027 Tier II report (due March 1, 2028).
Key to remember: EPA has aligned regulations under EPCRA Sections 311 and 312 with OSHA’s HazCom amendments for hazardous chemical reporting requirements.
NewsProcess Safety ManagementRisk Management ProgramRisk Management ProgramCAA ComplianceIn-Depth ArticleEnglishSafety Data SheetsIndustry NewsSafety & HealthGeneral Industry SafetyGeneral Duty ClauseEnvironmentalFocus AreaHazardous Materials Safety - OSHAHazard CommunicationGeneral Duty ClauseAir ProgramsUSA
2026-06-23T05:00:00Z
CSB mounts pressure on OSHA, EPA over deadly process safety gap
Sugar may seem pretty harmless. However, a deadly explosion at a Kentucky caramel coloring facility reveals how this assumption can lead to disaster. The Chemical Safety and Hazard Investigation Board (CSB) is again urging OSHA and EPA to address a gap in their chemical safety regulations.
The board is calling for them to tackle “reactive hazards.” These are the hazards CSB says triggered the tragedy. The familiar message has been repeated since 2002, but the alarm bells grow louder and more urgent now. These warnings are not just for OSHA and EPA. They are also for chemical plants and food ingredient manufacturers. Despite not being covered in the process safety and risk management standards, reactive hazards can and have led to catastrophe.
Runaway reaction
CSB determined that the explosion happened when a 2,500-gallon reactor experienced a runaway decomposition reaction. The reaction involved an “invert sugar” ingredient used to make caramel coloring. It rapidly increased the temperature and pressure. Then it overwhelmed the reactor’s emergency pressure relief system.
The reactor ruptured violently. Two workers died when the blast damaged a control room 40 feet from the reactor. Debris from the incident traveled as far as 400 feet beyond the facility fence line. It also caused approximately $40 million in damage.
CSB found that the reactor’s emergency pressure relief system would have needed to be about four times larger. This would have allowed it to safely relieve pressure generated during the runaway reaction.
Failure to recognize the hazard
CSB’s investigation found that the company did not understand the severe reactive hazards associated with the sugar ingredient. According to the board, this failure contributed to an undersized pressure relief system. It also created confusion on the day of the incident about the increasing pressure.
The report further states that the company’s lack of knowledge stemmed from:
- An incomplete investigation of the ingredients’ reaction potential,
- A lack of industry guidance on the safe manufacture of caramel coloring, and
- No warning on the safety data sheet (SDS) of reaction hazards.
SDS lacked critical information
The board found that the SDS provided by the sugar manufacturer did not warn of its reactivity hazards. CSB concluded that safety information communicated in sugar ingredient SDSs can vary significantly among suppliers. The board noted that improved hazard information in SDSs can help prevent future sugar decomposition incidents. CSB is urging industry groups and suppliers who manufacture invert sugar or corn syrup to update their SDSs for decomposition hazards.
Known regulatory gap
The report emphasizes a gap in:
- OSHA 29 CFR 1910.119, Process Safety Management of Highly Hazardous Chemicals (PSM); and
- EPA 40 CFR 68, Chemical Accident Prevention Provisions, also known as the Risk Management Program (RMP).
That gap is a lack of coverage of facilities processing chemicals with reactive hazards that could have catastrophic consequences.
The Kentucky caramel coloring plant was not subject to PSM and RMP. Had the facility been required to implement either regulation, the reactor designers would have had a better opportunity to be aware of the sugar ingredients’ decomposition hazards, says CSB. The board argues that this may have resulted in a safer design of the emergency pressure relief system.
Repeated recommendations
Since 2002, CSB has reiterated its recommendations for OSHA and EPA to fill the regulatory gap. Neither agency has implemented those recommendations.
Over that same period, the board investigated 15 additional incidents involving reactive chemicals not covered by PSM and RMP. Those incidents resulted in 31 fatalities and hundreds of injuries.
CSB is not deterred
CSB again recommends that OSHA and EPA broaden the coverage of PSM and RMP, respectively, to achieve more comprehensive control of reactive hazards.
Both OSHA and EPA currently use chemical lists to identify the processes subject to coverage. However, CSB claims the two agencies did not adequately consider reactive chemical hazards when developing those chemical lists. As a result, many reactive chemicals are currently not covered.
Word for employers and safety professionals
The latest report highlights the need for:
- Facilities to review not just the SDS for their chemicals but also additional sources of information about their reactive hazards.
- Chemical plants and food manufacturers to address reactive hazards regardless of coverage under 1910.119 and Part 68. At a minimum, these facilities may already be required to meet OSHA’s General Duty Clause and EPA’s Clean Air Act General Duty Clause.
Key to remember
The latest CSB report taps OSHA and EPA to address reactivity hazards. It is also a wake-up call for facilities to understand their reactive chemical hazards. What’s more, the report calls on chemical and food ingredient manufacturers to revisit their SDSs regarding reactive hazards.
New Network Poll


No active poll
Please come back soon!
Most Popular Highlights In Environmental
NewsIndustry NewsEnglishEnvironmental Management SystemsISO 14001Environmental Management SystemsEnvironmentalIn-Depth ArticleLifecycle AnalysisEnvironmental Management SystemsFocus AreaUSA
2026-07-14T05:00:00Z
ISO 14001:2026 arrives: Key changes for environmental management systems
Environmental management has changed significantly since ISO 14001 was last revised in 2015. Climate-related risks, resource constraints, supply chain challenges, and stakeholder expectations have reshaped how organizations manage environmental issues. In response, the International Organization for Standardization (ISO) released ISO 14001:2026, the first major update to the environmental management system (EMS) standard in over a decade.
The revised standard doesn't change the purpose of ISO 14001. Organizations will continue to use an EMS to identify environmental aspects, meet compliance obligations, manage environmental risks, and improve environmental performance. However, the new edition clarifies requirements and places greater emphasis on measurable environmental results. ISO says the revision is intended to better align EMS programs with today's environmental challenges. Organizations certified to ISO 14001 may need to update procedures, documentation, audits, and management reviews.
Why was the standard updated?
When ISO published ISO 14001:2015, many organizations focused primarily on regulatory compliance. While compliance remains a core component of an EMS, environmental managers today face a broader range of issues. Climate impacts, resource availability, supply chain disruptions, and stakeholder expectations can all affect environmental planning and performance. Rather than creating an entirely new framework, the 2026 version largely builds on concepts that already existed in the 2015 edition while expanding and clarifying expectations.
Environmental context receives greater attention
A major theme of the revision is a stronger focus on organizational context. Organizations are expected to look beyond day-to-day compliance activities when identifying environmental risks and opportunities.
The revised standard emphasizes consideration of environmental conditions that may affect the EMS, including climate-related concerns, biodiversity, ecosystem impacts, and natural resource availability. Organizations are expected to evaluate how external issues and stakeholder expectations may influence environmental objectives and planning.
For environmental managers, this may mean expanding annual EMS reviews to evaluate emerging environmental issues that could affect operations, compliance obligations, permit conditions, or environmental objectives.
Change management moves into the spotlight
The revised standard also introduces a more structured approach to managing change. Many organizations already evaluate environmental impacts when making operational changes, but those reviews are often informal.
ISO 14001:2026 expects organizations to plan, manage, and evaluate changes that may affect environmental performance. Examples include:
- Installing new equipment,
- Expanding production capacity,
- Changing raw materials,
- Modifying waste management practices,
- Switching suppliers, and
- Adding new products or processes.
This requirement should sound familiar to many environmental professionals. Operational changes can affect air emissions, waste generation, wastewater discharges, stormwater exposure, and permit applicability. A structured review process can help identify environmental impacts before changes are implemented.
Lifecycle thinking and supply chains gain importance
Lifecycle thinking was already part of ISO 14001:2015, but the revised standard places greater emphasis on it. Organizations are expected to consider environmental impacts throughout the lifecycle of products and services, including activities involving suppliers, contractors, and externally provided products and services.
This requirement doesn't mean organizations are responsible for every environmental impact within their supply chain. Rather, it encourages organizations to understand how purchasing decisions, outsourced activities, and supplier relationships may affect environmental performance.
For some organizations, this could mean greater emphasis on supplier evaluations, procurement procedures, contractor oversight, or product stewardship initiatives.
Leadership involvement becomes more visible
ISO 14001:2026 also strengthens expectations related to leadership accountability. Environmental management is no longer viewed solely as the responsibility of the environmental department.
The revised standard emphasizes visible leadership involvement and broader organizational participation. Environmental responsibilities may extend beyond EHS personnel to departments such as operations, purchasing, engineering, and management. Organizations will need to demonstrate that leadership is actively engaged in environmental planning, resource allocation, and performance evaluation activities.
What should organizations do now?
Although organizations have time to prepare for the transition, environmental managers may want to begin evaluating their programs now. Early reviews can help identify gaps and reduce the likelihood of surprises during future audits.
Questions organizations may want to consider include:
- Does the EMS adequately address climate, resources, and other emerging environmental issues?
- Is there a documented process for evaluating environmental impacts before operational changes are made?
- Are lifecycle considerations incorporated into purchasing and contractor management activities?
- Can leadership involvement be demonstrated through documented actions and decisions?
- Do environmental objectives show measurable performance improvements?
While ISO 14001:2026 is an evolution of the existing standard rather than a complete overhaul, organizations shouldn't assume existing EMS procedures will meet the revised expectations. Environmental managers may want to review how their systems address organizational context, change management, lifecycle considerations, and leadership involvement before their next audit.
Key to remember: For environmental professionals, the revised standard provides an opportunity to strengthen that connection and demonstrate the value that effective environmental management brings to the organization.
NewsWasteTSCA ComplianceWater ProgramsEnvironmental Protection Agency (EPA)CAA ComplianceWater ProgramsCWA ComplianceWaste/HazWasteEnglishAir ProgramsIndustry NewsIndustry NewsWasteEnvironmentalFocus AreaSARA ComplianceAir ProgramsUSA
2026-07-09T05:00:00Z
EPA releases 2026 regulatory agenda
The Environmental Protection Agency (EPA) published the 2026 Agenda of Regulatory and Deregulatory Actions on July 3, 2026. The agenda outlines the agency’s upcoming regulatory actions and their status in the rulemaking process. Many of the proposed and final rules support EPA’s continued deregulatory efforts.
Significant rulemaking on EPA’s docket includes the following:
- Proposing risk management regulations under the Toxic Substances Control Act (TSCA) for various chemical substances, such as formaldehyde, diisodecyl phthalate (DIDP), and diisononyl phthalate (DINP);
- Aligning the definition of “waters of the United States” with the Supreme Court’s Sackett v. Environmental Protection Agency (2023) decision, which narrowed the definition under the Clean Water Act;
- Finalizing the part 2 risk management regulations for asbestos, including use and associated disposal requirements for legacy asbestos, asbestos-containing talc, and asbestos fibers other than chrysotile;
- Repealing the Carbon Pollution Standards (CPS) that limit greenhouse gas emissions from fossil fuel-fired plants (or repealing a narrower set of requirements under the CPS); and
- Establishing a federal permitting program under the Resource Conservation and Recovery Act (RCRA) for the disposal of coal combustion residuals (CCR).
Additionally, EPA continues to conduct rulemaking related to per- and polyfluoroalkyl substances (PFAS), such as:
- Revising existing effluent limitations guidelines and standards (ELGs) to address PFAS discharges from PFAS manufacturing facilities and chromium electroplating facilities;
- Extending the compliance deadlines for Maximum Contaminant Levels established by the National Primary Drinking Water Regulations (NPDWRs) for perfluorooctanoic acid (PFOA) and perfluorooctane sulfonic acid (PFOS); and
- Rescinding the NPDWRs for four PFAS.
This article highlights some of the major rules we’re monitoring closely. You can review the entire agenda to learn about all the rulemakings EPA plans to review, propose, and finalize. Please note that the agenda dates are tentative, indicating when the agency seeks to publish the rulemakings in the Federal Register.
| Final Rule Stage | |
| Projected publication date | Title |
| July 2026 | Reconsideration of the Greenhouse Gas Reporting Program |
| August 2026 | 1-Bromopropane (1-BP); Regulation Under the Toxic Substances Control Act (TSCA) |
| October 2026 | Revisions to Standards for the Open Burning/Open Detonation of Waste Explosives |
| October 2026 | Secondary Lead Smelting: National Emissions Standard for Hazardous Air Pollutants (NESHAP) Technology Review and Reconsideration |
| January 2027 | Listing of Specific PFAS as Hazardous Constituents |
| Proposed Rule Stage | |
| Projected publication date of notice of proposed rulemaking | |
| August 2026 | Improving Recycling and Management of Renewable Energy Wastes: Universal Waste Regulations for Solar Panels and Lithium Batteries |
| September 2026 | Effluent Limitations Guidelines and Standards for the Oil and Gas Extraction Category (40 CFR 435 Subpart E) |
| October 2026 | Effluent Limitations Guidelines and Standards for the Centralized Waste Treatment Category (40 CFR 437) |
| December 2026 | Clean Water Act Hazardous Substance Facility Response Plans; Amendment Reconsideration |
| December 2026 | National Emission Standards for Hazardous Air Pollutants: Stationary Combustion Turbines; Amendments |
| Pre-Rule Stage | |
| Projected publication date or other action | Title |
| January 2027 (final rule) | Risk Management Program, CAA Section 112(r)(7) (Section 610 Review) |
| August 2026 (begin review) | Oil and Natural Gas Sector: Emission Standards for New, Reconstructed, and Modified Sources (Section 610 Review) |

NewsIndustry NewsCAA ComplianceEnvironmentalIn-Depth ArticleFocus AreaEnglishAir PermittingAir ProgramsAir ProgramsUSA
2025-05-21T05:00:00Z
Compliance guide: Air regulations for emergency generator installation
In today's rapidly evolving energy landscape, businesses are turning to back-up emergency generators to keep operations running smoothly. Several key factors are driving this growing trend:
- Extreme heat and weather events
Climate change has led to more intense weather like hurricanes, wildfires, and heatwaves. These events put pressure on power grids, causing outages that disrupt business operations. Generators help by providing backup power during unexpected failures.
- Power demand from AI and data centers
Artificial intelligence (AI) and data centers need a lot of electricity. As these technologies grow, power grids struggle to keep up. Companies use generators to prevent power shortages and keep essential systems running.
- Grid reliability concerns
Aging infrastructure and unsteady energy supply from renewable sources can make electrical supply unstable. Industries like manufacturing, healthcare, and finance need steady power to avoid costly interruptions. Generators act as a safety net when the grid fails.
Compliance considerations
Backup generators help keep businesses running, but they also impact the environment. Companies must follow air quality regulations to reduce pollution and operate safely.
Air permits
- State agencies usually oversee air permits, but The U.S. Environmental Protection Agency (EPA) has granted many county and city agencies the authority to issue them. For major permits such as New Source Review (NSR) and Title V, federal regulations apply, but state or local governments may still manage the process.
- In some areas, businesses can apply for a general permit or permit-by-rule for emergency generators. These permits are often easier to obtain and take less time to process. Checking air permitting regulations will help determine if this option is available.
- Businesses should find out if they need a pre-construction or construction air permit before setting up an emergency generator. These permits are based on the proposed equipment’s potential to emit (PTE) of criteria pollutants such as NOx, SO2, CO, and CO2 and hazardous air pollutants (HAPs) such as formaldehyde and acrolein, which are emitted during the combustion of fuel. The type(s) of fuel used in the generator, such as diesel, natural gas, gasoline, or propane, will affect the calculated PTE. Read more about construction permits in this ezExplanation: New Source Review (NSR).
(Note: many state and local permitting agencies allow for the use of 500 hours for calculating PTE from an emergency engine, as per EPA’s 2011 Fox Memo, but some agencies still require using 8,760 hours and only accept 500 hours as an enforceable limit defined in a permit.)
- Federal law sets a limit on emergency generators, allowing less than 100 hours of non-emergency use per year. This includes maintenance and testing. Some permits may also restrict the times of day when the generator can be used for non-emergency purposes.
- The permit may require businesses to use the generator according to the manufacturer’s specifications. This is especially important if the business used manufacturer guarantees to calculate PTE.
- Businesses must track fuel use and operating hours to stay within the limits used in emissions calculations. They can do this using fuel records, fuel measuring devices, and hour meters that log the generator’s usage time.
- After getting a construction permit, a facility may need to apply for an operating permit within a year of the generator beginning operation. Some state and local agencies have stricter rules and deadlines. Check out J. J. Keller’s ezExplanation for Operating Permits: Clean Air Act: Operating Permits
EPA emission standards
The EPA enforces strict emissions regulations for stationary engines. Businesses must ensure their generators meet the New Source Performance Standards (NSPS) for compression ignition (40 CFR 60 Subpart IIII) and spark ignition internal combustion engines (ICE) (40 CFR 60 Subpart JJJJ). Additionally, the National Emission Standards for Hazardous Air Pollutants (NESHAP) apply to reciprocating internal combustion engines (RICE) (40 CFR 63 Subpart ZZZZ).
These rules, depending on the specific type of generator engine, will be required even if a permit is not necessary.
Other regulations
Keep in mind that using an emergency generator may also involve other factors depending on the type and amount of fuel stored:
- Aboveground Storage Tank (AST) Requirements
- Spill Prevention Control and Countermeasure (SPCC) Plans
- EPCRA Tier II Reporting
Key to remember: When installing an emergency generator, companies must navigate complex air quality regulations to ensure compliance. By selecting the right fuel type and securing necessary permits, businesses can maintain reliable power while minimizing environmental impact.

NewsPersonal Protective EquipmentFall ProtectionWalking Working SurfacesFall ProtectionIn-Depth ArticleStorage TanksLaddersEnglishPersonal Protective EquipmentIndustry NewsSafety & HealthGeneral Industry SafetyEnvironmentalFocus AreaUSA
2026-01-26T06:00:00Z
Proposal expected: OSHA to step away from costly fixed-ladder deadline
OSHA is fast-tracking a proposed rule to remove a 2036 mandate to upgrade fall protection systems on fixed ladders that extend over 24 feet. The agency says the change, sparked by an industry petition, would allow employers to update their ladders at the end of their service lives, rather than by a hard compliance date. OSHA frames the move as deregulatory.
| News Update: OSHA’s proposed Walking-Working Surfaces rule appears in the April 6, 2026, Federal Register, available here. The proposal would strike 29 CFR 1910.28(b)(9)(i)(D) from the regulations, removing the 2036 deadline by which all fixed ladders extending more than 24 feet must be equipped with personal fall arrest systems or ladder safety systems. The remaining subparagraphs of 1910.28(b)(9)(i) would remain essentially the same, meaning new or replacement ladders over 24 feet would still be required to be equipped with a personal fall arrest system or a ladder safety system. However, without the hard deadline, required upgrades could wait until the fixed ladders reach the end of their service lives. OSHA is also seeking comment on whether to repeal or revise the requirement that employers use personal fall arrest systems on all fixed ladders over 24 feet, and instead permit the continued use of ladder cages or wells. OSHA asks whether cages and wells provide equivalent safety outcomes compared to personal fall arrest systems or ladder safety systems. This question and eight others are listed in the proposed rule. Comments and information are due on or before June 5, 2026. |
The affected regulation, 29 CFR 1910.28(b)(9)(i)(D), currently reads: “(i) For fixed ladders that extend more than 24 feet (7.3 m) above a lower level, the employer must ensure: … (D) Final deadline. On and after November 18, 2036, all fixed ladders are equipped with a personal fall arrest system or a ladder safety system.”
What’s happened?
A quick look at the rule’s development shows:
- 7/28/2025 — OSHA received a petition for rulemaking that covers obligations for ladder retrofits under 1910.28(b)(9).
- 9/15/2025 — OSHA posted a memo confirming it intends to eliminate 1910.28(b)(9)(i)(D).
- 12/18/2025 — OSHA sent its Walking-Working Surfaces (WWS) - Fixed Ladders proposal to the Office of Management and Budget (OMB) Office of Information and Regulatory Affairs (OIRA).
- 1/13/2026 — OIRA and OSHA met with the American Fuel and Petrochemical Manufacturers (AFPM).
- 1/21/2026 — OIRA and OSHA met with the Employers OSHA Modernization Coalition.
- 1/27/2026 — OIRA plans to meet with attorneys representing the American Petroleum Institute (API).
What did the petition request?
The seven-page petition, written by legal counsel on behalf of the AFPM, API, and American Chemistry Council (ACC), requests that OSHA:
- Withdraw the provision under the WWS standard for fixed ladders that extend more than 24 feet to be equipped with personal fall arrest systems (allowing the continued use of ladder cages or wells); or
- Grandfather fixed ladders installed before a particular date (authorizing the continued use of existing ladder cages or wells for those ladders).
Unjustified provision?
Petitioners argue that OSHA, in its 2010 proposed WWS rule, failed to:
- Take comments on the effectiveness of cages in protecting workers from falls,
- Disclose that the agency was evaluating whether to prohibit cages, and
- Give stakeholders a chance to submit evidence regarding cages.
The petition outlines the differences between the earlier proposed and final rules, noting that the 2010 proposal gave employers the choice to use any of four fall-protection types — cages, wells, ladder safety systems, or personal fall protection systems. However, the 2016 final rule gave a 2036 phase-out date for cages and wells.
The petition goes on to contend that:
- OSHA lacks sufficient evidence to justify prohibiting cages and wells;
- Data collected during the rulemaking process leaned toward preserving employer choices for fall protection; and
- Although the 2016 rulemaking preamble acknowledged the shift away from cages and wells, it did not fully discuss evidence in favor of cages and wells.
Other arguments in the petition
The petition raises several points questioning the benefits of paragraph (b)(9)(i)(D), stating that:
- In the past decade, AFPM, API, and ACC facilities have suffered only a few injuries, with no fatalities involving cages and wells;
- Cages offer passive protection, whereas ladder safety systems and personal fall arrest systems require workers to take action to comply;
- Personal protective equipment (PPE) lies at the bottom of the hierarchy of controls;
- Safety risks also exist for ladder safety systems and personal fall arrest systems; and
- Installing new ladders or retrofitting existing ones introduces hazards to those performing that work.
Finally, the petition addresses significant compliance costs, estimating several billion dollars for tens of thousands of ladders at U.S. refineries alone. Petitioners also cited additional expenses for rerating pressure vessels and engineering any process equipment changes.
What does OSHA say?
OSHA officially announced in a September 2025 memo that it is proposing to remove 1910.28(b)(9)(i)(D). The agency calls it a deregulatory action in line with Executive Order 14192. The memo reasons, “OSHA anticipates this change will allow employers to update their ladders when the ladders reach the end of their service lives, accommodating the lengthy service life of fixed ladders, while significantly reducing costs and offering greater flexibility.”
The WWS - Fixed Ladders proposal reached OIRA on December 18. OIRA typically takes 90 to 120 days for review, but recently a maximum 28-day review period for deregulatory actions was implemented. That means we anticipate OIRA will rush this proposal, so that OSHA may publish it in the Federal Register.
Key to remember
An upcoming OSHA proposal would withdraw 1910.28(b)(9)(i)(D). The rule was spurred by a petition.
NewsWater PermittingChange NoticesChange NoticeWater ProgramsWater QualityWater ReportingFloridaEnvironmentalWater ProgramsEnglishFocus AreaCWA Compliance
2025-12-02T06:00:00Z
Florida allows reciprocity for water system operator licensing
Effective date: November 6, 2025
This rule applies to: Out-of-state licensed treatment plant operators and distribution system operators
Description of change: The Florida Department of Environmental Protection adopted rules to:
- Implement licensure reciprocity, allowing the department to issue licenses by reciprocity to water treatment, domestic water treatment, and water distribution system operators with out-of-state licenses; and
- Allow the department to issue temporary operator licenses during a declared state of emergency to out-of-state licensed treatment plant and distribution system operators during a declared state of emergency.
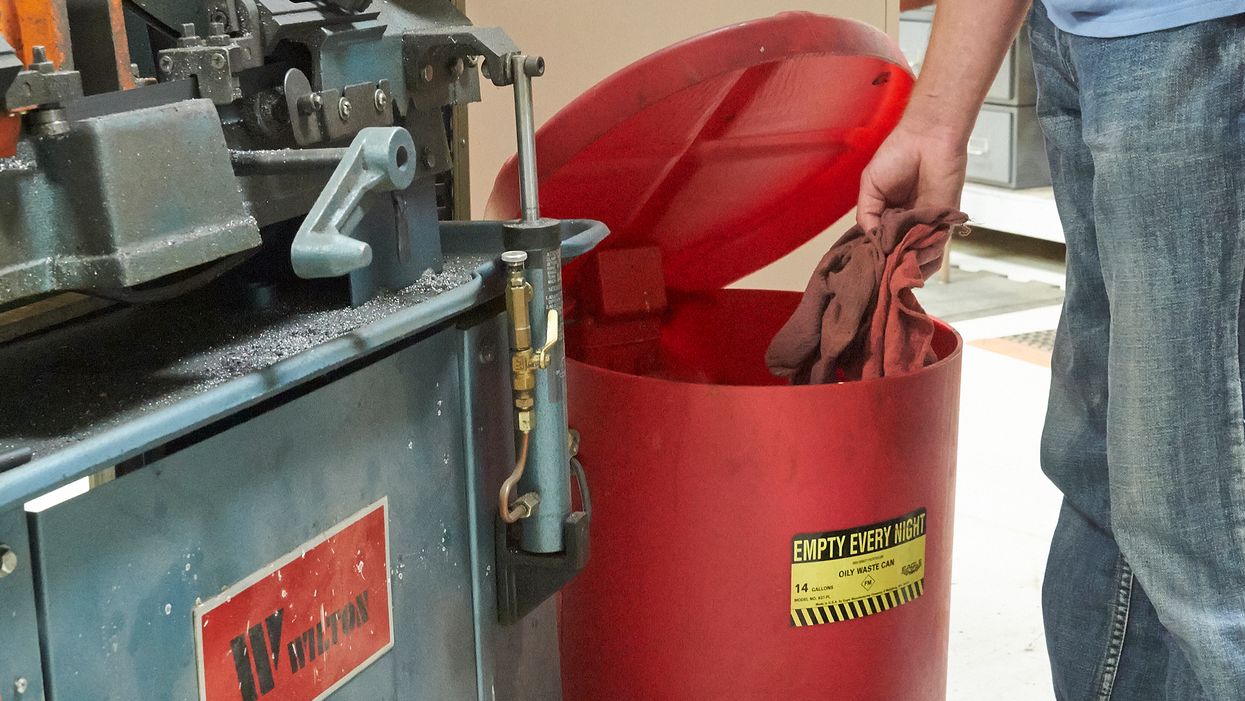
NewsIndustry NewsWaste/HazWasteSafety & HealthConstruction SafetyGeneral Industry SafetyWasteEnvironmentalIn-Depth ArticleCWA ComplianceUsed OilEnglishFocus AreaUSA
2025-03-03T06:00:00Z
Used oil disposal: How to stay compliant with EPA, OSHA, and your state
Used oil disposal is a critical issue for safety managers and shop supervisors in industrial settings. Whether your facility generates used oil from machinery, vehicles, or hydraulic systems, you must understand the regulatory requirements to ensure compliance and avoid hefty fines.
Used oil is not always considered hazardous waste, but improper handling, storage, or disposal can lead to regulatory violations and environmental hazards. Understanding how used oil is classified, when it is considered hazardous, and how to manage it in compliance with 40 CFR Part 279 is essential.
Let’s uncover the regulatory framework for used oil disposal, including storage requirements, transportation rules, and best practices to ensure compliance at both the federal and state levels.
What is used oil?
The EPA defines used oil as any petroleum-based or synthetic oil that has been used and is contaminated by physical or chemical impurities. Common sources of used oil in industrial operations include:
- Motor oil and lubricants from vehicle maintenance
- Hydraulic fluids used in heavy machinery
- Metalworking fluids and coolants
- Compressor oils used in air compression systems
According to EPA regulations (40 CFR Part 279), used oil is presumed to be managed under the less stringent used oil management standards unless it meets hazardous waste criteria.
Used oil becomes hazardous waste if:
- It is mixed with hazardous waste (e.g., solvents or heavy metals)
- It contains more than 1,000 parts per million (ppm) of total halogens, unless proven otherwise, or
- It is disposed of improperly, leading to environmental contamination.
If used oil is classified as hazardous waste, it must be managed in accordance with the applicable solid and hazardous waste requirements.
EPA requirements for used oil disposal
The EPA requirements for used oil consist of three different aspects, as outlined below.
1. Storage Requirements
Use leak-proof tanks and containers made of durable, non-earthen materials (e.g., steel, plastic, or concrete). Label all used oil containers with the words "Used Oil" to prevent misidentification. Prevent leaks and spills by using secondary containment systems and regularly inspecting tanks. Never mix used oil with hazardous waste unless authorized.
2. Transportation and Disposal
Used oil generators may transport up to 55 gallons of used oil to a registered collection center without an EPA ID number. If contracting a used oil transporter, ensure they have an EPA Identification Number.
Used oil must be:
- Recycled or re-refined into new oil.
- Burned for energy recovery in approved furnaces or boilers.
- Disposed of at an authorized hazardous waste facility if deemed hazardous.
3. Spill Prevention and Cleanup
Facilities storing large amounts of used oil must have a Spill Prevention, Control, and Countermeasure (SPCC) Plan. SPCC plans establish procedures, methods, and equipment requirements to prevent oil from reaching waterways, and to contain discharges of oil.
Any spills must be cleaned up immediately, and absorbent materials must be disposed of properly. Rags and shop towels contaminated with hazardous materials may be classified as hazardous waste.
OSHA regulations for handling used oil
While the EPA focuses on environmental compliance, OSHA (29 CFR Part 1910) regulates worker safety when handling used oil. Key OSHA requirements include:
1. Personal Protective Equipment (PPE)
Workers handling used oil must wear gloves and protective clothing to prevent skin exposure. Safety goggles or face shields are also important to avoid eye contact.
2. Hazard communication (HazCom) program
Employers must label all used oil containers with appropriate hazard information and train employees on safe handling procedures and emergency response.
3. Fire and Explosion Safety
Always store used oil away from ignition sources to prevent fire hazards. Ensure storage areas are ventilated to avoid vapor buildup.
State-Specific used oil disposal regulations
Many states have stricter used oil regulations than federal laws. For example:
- California classifies used oil as hazardous waste unless it meets specific recycling criteria.
- Texas requires additional storage permits for large generators.
- New York mandates annual reporting on used oil disposal activities.
To ensure compliance, check with your state’s environmental agency for state-specific used oil disposal rules and whether used oil is considered hazardous. Additional permits for transporting or processing used oil may be necessary.
Staying compliant with used oil disposal requirements
Ensuring compliance with EPA, OSHA, and state laws is essential for safety managers and shop supervisors handling used oil. By following proper storage, transportation, and disposal practices, businesses can reduce environmental risks, improve workplace safety, and avoid costly fines.
Key to remember: By staying informed and proactive, your facility can maintain safe, sustainable, and compliant used oil management practices.
Most Popular Highlights In Transportation

NewsIndustry News16-hour short-haul exceptionFleet Safety150 air-mile radius exceptionHours of ServiceHours of ServiceFocus AreaIn-Depth ArticleEnglishTransportationUSA
2025-04-03T05:00:00Z
5 short-haul exceptions and how to use them
Commercial drivers who stay relatively close to home are often required to follow the same DOT safety regulations as long-haul truckers, but there are some exceptions they can take advantage of.
Most of these “short-haul” exceptions relate to the hours-of-service rules and provide a break from either the recordkeeping requirements or the limits on work hours.
The following are five commonly used exceptions from the federal (interstate) hours-of-service requirements for drivers who stay close to home. Review the terms to see if your drivers qualify, and remember: Drivers should never try to claim an exception unless they have a clear understanding of how it works and when it can be used.
Note that state requirements and exceptions may vary for intrastate operations.
1. 150-air-mile (CDL) exception
Who’s eligible? Drivers of property-carrying vehicles (“trucks”) that require a commercial driver’s license (CDL), and drivers of passenger-carrying vehicles (shuttles/vans/buses), who return to the starting location at the end of the day.
What are they exempt from? Standard grid-style logs (records of duty status), supporting documents (see 395.11), and 30-minute breaks (see 395.3(a)(3)(ii)).
What’s the maximum distance? 172.6 miles away from the reporting location (150 air miles) measured in a straight line in any direction.
What other conditions apply? On any day the exception is used, the driver must:
- Not drive a commercial motor vehicle (CMV) beyond the 150-air-mile radius,
- Return to the work-reporting location at the end of the day (unless classified as a driver-salesperson),
- Be completely off duty within 14 consecutive hours of the starting time, and
- Be off work for 8 (bus) or 10 (truck) consecutive hours before coming back on duty.
The driver remains subject to the daily limit of 10 (bus) or 11 (truck) driving hours and the weekly on-duty limit of 60 or 70 hours.
Which records are required? The motor carrier must have a record of the driver’s starting time, ending time, and total on-duty time for the day, and it must be retained for six months. “Driving” time does not need to be recorded separately from on-duty time, and drivers are not required to have records in the vehicle (though it is a recommended practice).
Where’s the rule? 49 CFR 395.1(e)(1)
2. 150-air-mile (non-CDL) exception
Who’s eligible? Drivers of property-carrying vehicles (“trucks”) that do NOT require a CDL and who return to the starting location at the end of the day.
What are they exempt from? Standard grid-style logs (records of duty status), supporting documents (see 395.11), 30-minute breaks (see 395.3(a)(3)(ii)), and — up to twice per week — the 14-hour limit (395.3(a)(2)).
What’s the maximum distance? 172.6 miles away from the reporting location (150 air miles) measured in a straight line in any direction.
What other conditions apply? On any day the exception is used, the driver must:
- Not drive a CMV beyond the 150-air-mile radius;
- Return to the work-reporting location at the end of the day (but does not necessarily need to go off duty); and
- Not drive after the 14th consecutive hour on at least five days out of any seven consecutive days, or after the 16th consecutive hour on up to two days out of seven.
The driver remains subject to the daily limit of 11 driving hours and the weekly on-duty limit of 60 or 70 hours, as well as the need for 10 hours off between shifts.
Which records are required? The motor carrier must have a record of the driver’s starting time, ending time, and total on-duty time for the day, and it must be retained for six months. “Driving” time does not need to be recorded separately from on-duty time, and drivers are not required to have records in the vehicle (though it is a recommended practice).
Where’s the rule? 49 CFR 395.1(e)(2)
3. 16-hour “big day”
Who’s eligible? Drivers of property-carrying CMVs who return to the reporting location daily.
What are they exempt from? The 14-hour limit (395.3(a)(2)).
What’s the maximum distance? None. Drivers must remain close enough to home base that they can return there before hitting the 16-hour limit (or any other limit).
What other conditions apply? This is the only short-haul exception with a “look back” requirement. On the day the exception is used, the driver must:
- Have returned to the starting location on the prior five work days (not including days off, and even if the driver got a 34-hour restart);
- Be back to the starting location and released from duty within 16 consecutive hours after the start of the day; and
- Only use the exception if it was not already used within the previous six consecutive days, unless the driver got a 34-hour restart.
The driver must also comply with the 30-minute break rule, the 11-hour driving limit, the 60/70-hour limit, and the need for 10 hours off.
Which records are required? The driver must use a standard grid-style log (395.8) and keep supporting documents (395.11). A driver cannot claim both this exception and one of the 150-air-mile exceptions on the same day.
Where’s the rule? 49 CFR 395.1(o)
4. Construction materials & equipment
Who’s eligible? Any driver primarily transporting construction materials and equipment. This means the transportation of construction and pavement materials, construction equipment, and construction maintenance vehicles, to or from an active construction site (a construction site between mobilization of equipment and materials to the site to the final completion of the construction project). Placarded vehicles are not eligible.
What are they exempt from? The need to remain off duty for 34 hours to restart the 60/70-hour limit. Instead, these drivers may get a restart with just 24 hours off.
What’s the maximum distance? 86.3 miles (75 air miles) away from the work-reporting location, measured in a straight line in any direction (though states are allowed to set the limit as low as 50 air miles for in-state-only operations).
What other conditions apply? Drivers remain subject to all other requirements: 10 hours off, 11 hours of driving within a 14-hour period, 30-minute breaks, and the 60/70-hour on-duty limit.
Which records are required? These drivers should qualify for a 150-air-mile exception as described above. Otherwise, a standard grid-style log and supporting documents are required (395.8 and 395.11).
Where’s the rule? 49 CFR 395.1(m)
5. Driver-salespersons
Who’s eligible? Any driver for a private carrier of property who:
- Is engaged both in selling goods*, services, or the use of goods, and in delivering (by CMV) the goods sold or provided or upon which the services are performed;
- Drives no more than half the total work hours; and
- Drives no more than 40 hours in any seven consecutive days.
*“Selling goods” includes soliciting or obtaining reorders or new accounts, or other selling or merchandising activities designed to retain customers or to increase the sale of goods or services.
What are they exempt from? The 60-hour/7-day or 70-hour/8-day limit.
What’s the maximum distance? 100 miles (not air miles) away from the work-reporting location, measured in a straight line in any direction.
What other conditions apply? Drivers remain subject to all other requirements: 10 hours off, 11 hours of driving within a 14-hour period, and 30-minute breaks.
Which records are required? These drivers should qualify for a 150-air-mile exception as described above. Otherwise, a standard grid-style log and supporting documents are required (395.8 and 395.11). Note that if a driver-salesperson wants to take advantage of the option to not return to the starting location when using the 150-air-mile exception in 395.1(e)(1), the driver must remain within a radius of 100 miles.
Where’s the rule? 49 CFR 395.1(c)
What’s an ‘air mile’?
An air mile (also known as a nautical mile) is a bit longer than the standard “land” (statute) mile tracked on a vehicle’s odometer. One air mile is equivalent to 1.15 miles on the road. Therefore:
- 100 air miles = 115.1 land miles, and
- 150 air miles = 172.6 land miles.
What’s an “air-mile radius”?
A radius is a straight line from the center of a circle to its edge. If a driver must remain within a 150-air-mile radius of the starting location, for example, then the driver may travel up to 172.6 miles away from that location, measured in a straight line (“as the crow flies”) in any direction. Because most roads aren’t built in a straight line, drivers and motor carriers must refer to a map — or better yet, an online mapping tool — to determine where the geographic boundary lies.
Note that a driver limited to a 150-air-mile radius is not limited to driving a specific number of miles within the radius. For example, a truck driver may drive much more than 172 miles in a day and still claim the 150-air-mile exception, as long as all driving (up to 11 hours) took place within the 150-air-mile radius.
Aren’t we exempt from other safety rules?
Most short-haul exceptions are tied to the hours-of-service rules only. Short-haul operations are NOT exempt from rules governing driver qualification files, vehicle markings, daily and annual vehicle inspections, cargo securement, insurance, licensing, drug testing, and many other safety mandates.
Key to remember: Short-haul and regional drivers who return home each day are eligible for certain exceptions from portions of the hours-of-service rules, though state requirements may vary.
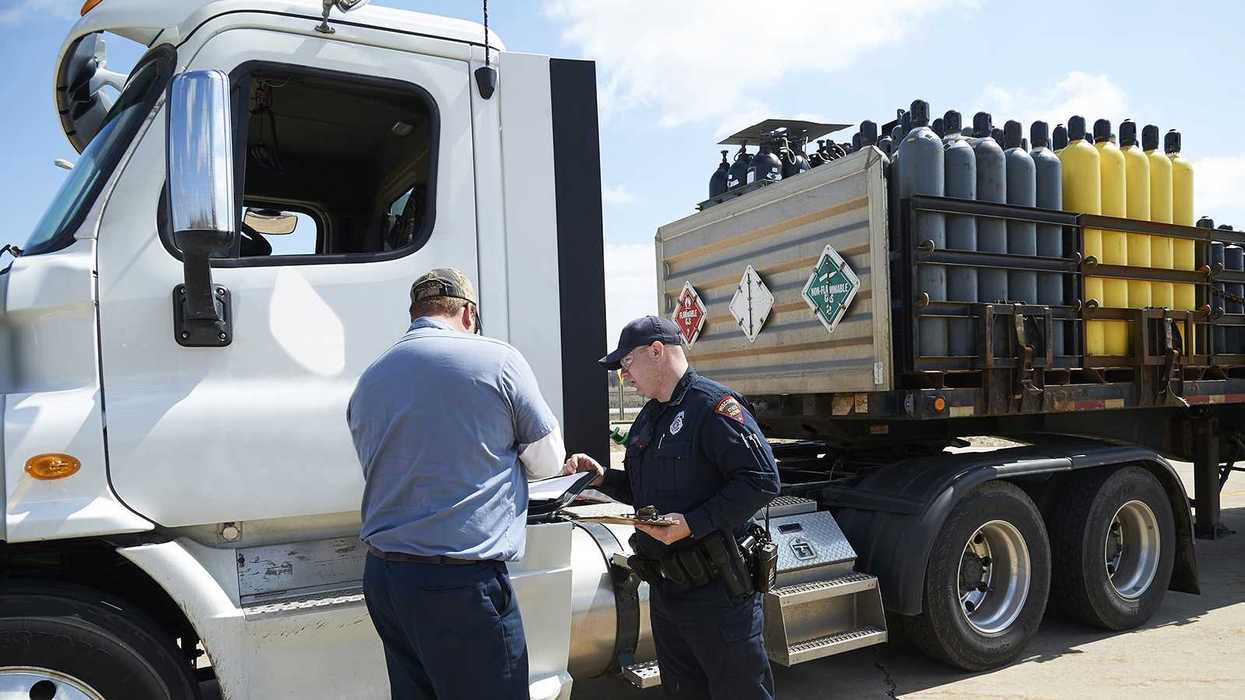
NewsIndustry NewsViolations - HazmatHazmat SafetyHazmat: HighwayFocus AreaIn-Depth ArticleEnglishTransportationUSA
2026-07-13T05:00:00Z
A midyear look at FMCSA's top hazmat violations
Roadside inspections are a fact of life for hazmat carriers. While inspectors encounter a wide range of compliance issues, Federal Motor Carrier Safety Administration (FMCSA) data shows that a handful of violations account for a significant share of hazmat citations year after year. Understanding these trends can help carriers focus their compliance efforts where they're likely to have the biggest impact.
Here's a look at the five most frequently cited hazmat roadside inspection violations so far in 2026 and what you can do to stay off the list.
1. Cargo not properly secured
The most common hazmat violation so far this year involves hazardous materials that weren’t properly blocked, braced, or secured during transportation. Inspectors recorded more than 1,000 of these violations.
To avoid this issue, verify that hazmat packages are adequately secured before departure and periodically check cargo during transit. Drivers should never assume a load was secured properly without conducting their own inspection.
2. Failure to produce a current hazmat registration
More than 400 violations were issued for failing to produce a current Pipeline and Hazardous Material Safety Administration (PHMSA) hazmat registration certificate or registration number during an inspection.
Usually, the company is registered but can’t provide proof of registration. Make sure registrations are renewed on time, current certificates are maintained, and employees know where the documentation is located.
3. No required shipping paper
FMCSA reported more than 360 violations involving vehicles operating without a required hazmat shipping paper.
Before a vehicle leaves the facility, confirm that the required shipping paper is present and complete. A simple shipping paper review as part of the pre-trip process can help prevent this violation.
4. Damaged or obscured placards
Nearly 350 violations involved placards that were damaged, faded, dirty, or otherwise difficult to read.
Include placards in routine vehicle inspections and replace them when necessary. Also ensure mud, snow, road grime, or other materials aren't obstructing their visibility.
5. Shipping paper accessibility
Rounding out the top five is shipping paper accessibility, with more than 340 violations reported so far this year.
Having a shipping paper isn't enough. It also has to be readily accessible. Drivers should be trained on accessibility requirements and consistently store shipping papers in the designated location. The best place for hazmat shipping papers in a vehicle is in a holder on the inside of the driver’s door.
A common theme
What's striking about the top violations so far this year is that most involve basic compliance fundamentals rather than complex regulatory requirements. Cargo securement, documentation, and placarding remain the areas where inspectors are finding the most problems.
Key to remember: Don't overlook the basics. Regular pre-trip inspections, refresher training, and periodic compliance reviews can go a long way toward preventing the violations that inspectors continue to find most often on the road.

NewsIndustry NewsInternational Registration Plan (IRP)Vehicle registration exemptionsMotorcoach vehicle license or registrationVehicle Registration PermitsFocus AreaIn-Depth ArticleFleet OperationsEnglishTransportationRegistration and Permits - Motor CarrierUSA
2026-07-09T05:00:00Z
Does your registration still match your operations?
A truck may have valid plates, current registration, and no obvious paperwork problem, yet still be improperly registered for the work it’s doing today.
As your fleet grows and operations change, it's easy for vehicle registration to lag behind reality. The result can be citations, permit issues, unexpected fees, operational delays, and compliance headaches. Here are three common situations where a registration may no longer match the operation.
Is your registered weight still accurate?
One of the most common registration issues involves registered weight. A vehicle may be legally capable of hauling heavier loads, but that doesn't necessarily mean it’s registered to do so.
As business grows, carriers often begin hauling larger loads, adding customers, or expanding routes. If your vehicle's registered weight isn't updated to reflect those changes, you could face penalties for operating above the weight authorized by its registration.
This issue often goes unnoticed because the truck itself hasn't changed. However, enforcement officials are concerned with how the vehicle is registered, not just what it’s capable of hauling.
Whenever freight volumes, routes, or operating weights change, review your registration records to ensure they still align with actual operations.
Is the vehicle operating under the right plate type?
Not all registrations are created equal. Many states offer specialty or reduced-fee registrations for certain operations, such as:
- Farm vehicles,
- Natural resource vehicles,
- Forestry operations, or
- Other restricted uses.
Specialty plates can save money, but they also come with strings attached. Carriers must comply with those limits for the registration to remain valid. Problems arise when a vehicle's operation changes but its registration does not.
For example, a vehicle may have been properly registered under a specialty plate when it was performing one type of work. If the vehicle later begins hauling different commodities, traveling outside permitted areas, or performing general commercial transportation, it may no longer qualify for that registration class.
A good practice is to review registration classifications whenever equipment is reassigned, new customers are added, or business activities expand beyond their original scope. The registration and the vehicle's use must continue to match.
Has interstate travel changed the rules?
Another common issue occurs when operations expand beyond your home state.
A vehicle that is properly registered for intrastate operations may require additional credentials or registrations once it begins operating across state lines. What starts as an occasional out-of-state trip can gradually evolve into a regular part of the business.
Because the change often happens incrementally, carriers may not realize that their registration and credentialing requirements have changed along with their operations.
Before crossing state lines, evaluate whether additional registration, apportioned registration, permits, or other interstate credentials are required. Waiting until a roadside inspection or audit to discover a registration issue can be a costly mistake.
Three questions to ask
New customers, new commodities, expanded routes, and heavier loads can all affect registration requirements. Before a vehicle goes back on the road after business changes, ask:
- Is this vehicle registered for the weight I'm operating at?
- Does the registration type still match how I'm using the vehicle?
- Has my operating area expanded beyond what the registration was intended to cover?
If the answer to any of those questions is "I'm not sure," it's time for a registration review.
Key to remember: Registration should never be treated as “set it and forget it.” If the operation changes, the registration may need to change with it.
NewsIndustry NewsFleet SafetyCMV Parts and MaintenanceParts and Accessories - Motor CarrierFocus AreaIn-Depth ArticleEnglishTransportationUSA
2023-08-17T05:00:00Z
Can I downrate a vehicle? Yes, but it won’t be easy
Customers often ask us questions like: “We no longer need the vehicle to be rated at 33,001 pounds. Can we downrate it to 26,000 pounds?” or “We have a vehicle rated at 11,000 pounds, can we downrate it to 10,000 pounds?” The short answer to both questions is yes, it can be done, but it won’t be easy.
Why the rating matters
The rating, along with the actual gross weight of the vehicle, is what officers on the road use to determine what regulatory requirements apply. If the vehicle is over 10,000 pounds (actual or rated), it is a commercial vehicle (see 390.5) and the vehicle and driver are subject to Parts 390 to 399 (vehicle marking, driver qualifications, hours of service, inspection and maintenance, annual inspections, etc.). If it is over 26,000 pounds and matches the definition of a commercial vehicle requiring a CDL to operate (see 383.5), then the driver is also subject to the drug and alcohol regulations (Part 382) and the CDL regulations (Part 383).
Changing the rating
The rating, correctly known as the gross vehicle weight rating (GVWR), is assigned by the vehicle manufacturer (either original or second in the case of an incomplete vehicle). It can be found on the rating and certification tag required by the National Highway Traffic Safety Administration (NHTSA). This tag, in many cases, is found on the driver’s side door frame.
As the manufacturer is the one that assigned the rating, that is who would need to downrate the vehicle. However, manufacturers typically will not downrate a vehicle unless they are involved in some type of rebuilding or remanufacturing that changes some major characteristics of the vehicle, such as the axles.
What about changing tires?
When discussing the issue of downrating, one suggestion is switching to lower rated tires and then asking for the downrating. The thought process here is that the vehicle cannot be loaded in excess of the tire ratings. However, manufacturers will not consider changing tires as being a significant change to the vehicle and will not downrate it. Also, officers on the road will not take tire ratings into consideration when calculating the GVWR. They will only look at the door tag.
VIN considerations
The other issue is that the GVWR is coded into the vehicle identification number (VIN). The problem here is even if you or an aftermarket vehicle alterer downrate the vehicle by putting on a new door tag, the VIN still includes the GVWR assigned by the manufacturer. An officer using a VIN verification/decoder will immediately see the original GVWR and this will lead to questions about why the GVWR in the VIN no longer matches the GVWR on the door tag and who made the changes and why (some officer’s systems automatically validate the VIN and check the vehicle’s status in various databases when a VIN is entered). This could be a major issue following a crash.
Key to remember: Downrating involves changing the manufacturer’s rating for the vehicle, and therefore, the manufacturer must be involved.
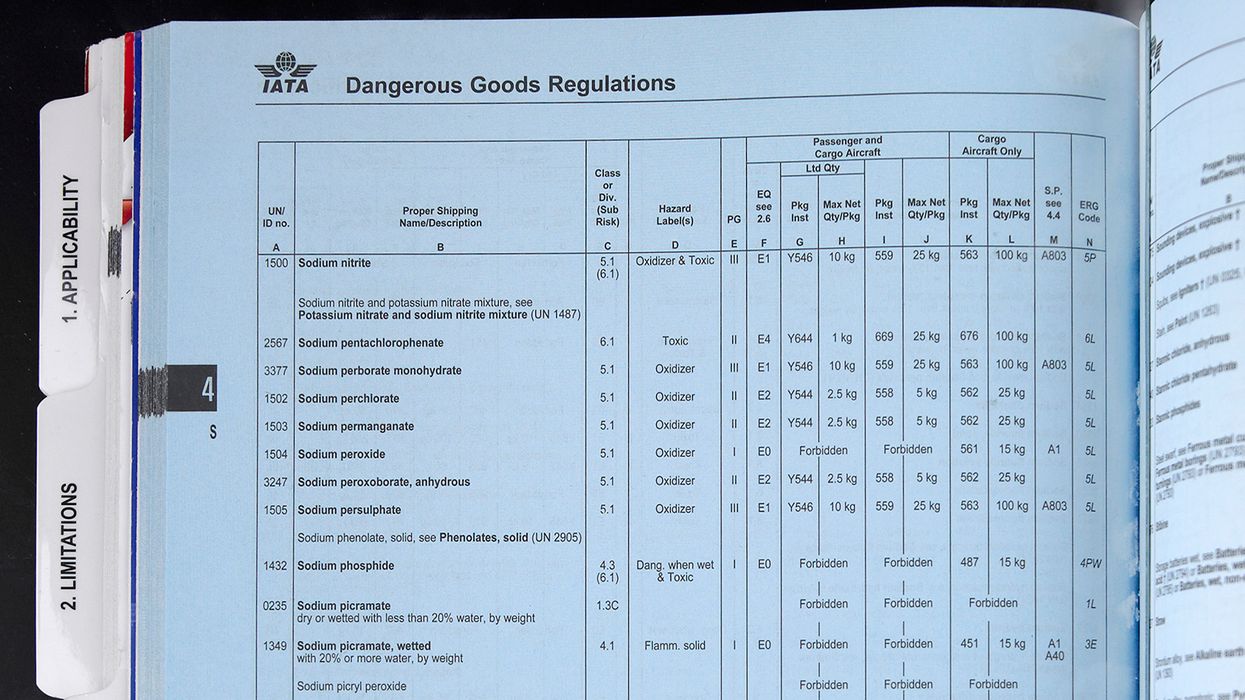
NewsIndustry NewsHazmat SafetyHazmatIn-Depth ArticleFocus AreaUSAEnglishTransportationHazmat Rulemaking procedures
2023-12-22T06:00:00Z
Navigating change: Key updates to 2024 IATA DGR take effect
Every year the International Air Transport Association (IATA) updates its Dangerous Goods Regulations (DGR) to ensure the safe and secure handling of dangerous goods that are shipped or transported by air. While changes to the 2024 IATA DGR (65th edition) are not as plentiful as they were in previous years, they are no less important.
Mandatory compliance with the 2024 IATA DGR begins on January 1, 2024, and will be valid until the 2025 IATA DGR comes into effect. Let’s look at the key updates, listed by Section, for the 65th edition of the IATA DGR:
Need additional information for IATA? Check out this ezExplanation.
Limitations
- Dangerous Goods Carried by Passengers or Crew (2.3)— Provisions for battery-powered mobility aids have been revised to include reference to the guidance on the end-to-end processes associated with the carriage of mobility aids.
Packing
The following packing instructions have been updated:
- 5.2.0.9 - Added a water capacity limit for non-refillable cylinders containing a flammable gas, limited to a water capacity not exceeding 1.25 L.
- PI 952 - Revised to include reference to "equipment."
- PI 954 - Clarified the rules for marking overpacks containing dry ice. The total net quantity of dry ice in the overpack must be marked on the outside of the overpack.
Packaging specifications and performance tests
- 6.0.3 - Clarified the requirements and formatting for UN specification marks on packages.
Documentation
- 8.1.6.9.2, Step 6 – Added a note to "reinforce that there is no requirement for the type, number and net quantity in inner packagings within the outer packaging of a combination packaging to be shown" on the shipping papers (Shippers Declaration for Dangerous Goods).
Radioactive materials
- 10.8.3.9.1—Added an additional example of the description for the first sequence of information on the Shipper's Declaration to address where a radioactive material has a subsidiary hazard, and the proper shipping name must be supplemented by the technical or chemical name.
- 10.8.6—Added two examples to show how radioactive materials with a subsidiary hazard should be described and how packages in an overpack should be shown.
Appendices
IATA has added a new appendix to the list of appendices in the DGR. Appendix H includes a list of changes IATA will make to the 2025 IATA DGR. IATA added Appendix H so that shippers and carriers have time to prepare for the substantial updates that are coming for 2025. Some of the changes include:
- Adding an exception for data loggers and cargo trackers with installed lithium batteries.
- Modifying the exception for COVID-19 vaccines to now apply to all pharmaceutical products.
- Adding a new classification for sodium ion batteries.
- Updating the list of dangerous goods and special provisions.
- Amending and adding several packing instructions.
- Revising the "lithium battery mark", which will be known as the "battery mark" in the future.
Making sure you are keeping up with these regulatory changes and preparing for future updates is extremely important if you want to avoid costly delays, fines, and lost revenue. Keep your hazmat employees up to speed and inform them of any changes they need to be aware of.
Key to Remember: IATA updates their DGR every year and changes to the 2024 IATA DGR become effective on January 1, 2024.

NewsIndustry NewsFleet SafetyRisk Management TransportationCMV Parts and MaintenanceParts and Accessories - Motor CarrierHazmat: HighwayFire extinguishers - Motor CarrierIn-Depth ArticleWarning devicesFocus AreaEnglishTransportationUSA
2023-07-18T05:00:00Z
What emergency equipment do Canadian carriers need in the vehicle?
Driving a truck can be a dangerous profession at times, so it’s crucial to prepare for emergencies. Emergency equipment will help keep your drivers safe on the road. But what’s required to be in the vehicle? According to Transport Canada, there are no federal regulations relating to the emergency equipment required for your standard, everyday commercial motor vehicles in Canada. However, the National Safety Code (NSC), requires carriers to ensure that their vehicles meet maintenance and performance standards as prescribed in the standards. Carriers also have a duty to comply with jurisdictional health and safety legislation pertaining to the workplace. Even though there may not be detailed federal regulations in place, and the requirements can vary among Canadian jurisdictions, you still need to ensure your drivers have what they need in an emergency. Plus, if your drivers are operating across the U.S.-Canadian border, they may need additional equipment while in the United States.
What do your drivers need?
The equipment requirements can vary slightly based on the type of vehicle, what it is hauling, and where it is operating. As a result, it can be confusing to find and understand minimum requirements. As a best practice, making sure the following emergency equipment is in your vehicles is a great start:
- Three bi-directional emergency reflective triangles;,
- Six flares capable of burning for 30 minutes or three liquid-burning flares that contain enough fuel to burn continuously for at least 60 minutes,
- A fire extinguisher,
- A first aid kit,
- A spare tire and jack,
- A flashlight and batteries, and
- Jumper cables.
Carriers that haul certain types of dangerous goods in Canada must also carry fire extinguishers in accordance with the Transportation of Dangerous Goods Regulations, so be sure to check these regulations for specific details.
It is highly recommended that you check with the jurisdiction where you operate your commercial motor vehicle for the specific requirements and regulations that apply to you.
When to take the necessary action
Whenever any commercial motor vehicle or trailer is disabled, stalled, broken down, or in a collision, the driver should quickly and calmly take the necessary actions to safeguard the vehicle and other motorists.
Having the vehicle equipped with the above-listed items will ensure that the driver can respond to the emergency efficiently and effectively. This is especially important on busy or high-speed roads. Ensure you also teach your drivers how to use the equipment. For example, if the truck breaks down – ensure they know where to put the emergency triangles, they know how to use the fire extinguisher properly and they have instructions on how to use jumper cables correctly.
It is recommended to use emergency warning devices for all emergencies, whether they occur during the day or night, or on-road or off the road, to ensure everyone’s safety.
What about south of the border?
Those of you that operate in the United States must meet U.S. regulations for emergency equipment in your vehicles. The minimum requirements can be found in section 393.95 of the Federal Motor Carrier Safety Regulations, which requires:
- A fire extinguisher (there are different types for whether the vehicle is carrying dangerous goods or not),
- Spare fuses, and
- Warning devices to use when stopped on a highway.
Other considerations
Ensure your commercial vehicles carry additional emergency equipment to protect the driver, other workers, and any passengers. For example, extra food and water should be carried along with weather-appropriate clothing to protect the driver in the event the vehicle breaks down and the driver is stranded until help can arrive. And, as always, make sure drivers have tire chains easily accessible. If they get hit by a sudden snowstorm, then they will be prepared. In fact, carrying tire chains is a requirement in some jurisdictions.
Dealing with on-road emergencies is no fun for drivers. Don’t make it more difficult for them in an already stressful situation. Be sure to properly equip your trucks with emergency-related safety equipment and ensure drivers know how to use the equipment.
If you don’t have the proper emergency equipment in your truck, it can result in a fine or penalty. Commercial motor vehicles and their drivers must meet strict safety standards and follow all commercial vehicle-related regulations. Police and transportation enforcement officers regularly inspect vehicles, and the penalties for not having the proper safety equipment can be severe.
Key to remember: Before your drivers get in your trucks and hit the road, make sure you’ve equipped them with all the essential emergency safety gear. Safety is the first priority, especially on the road.
Most Popular Highlights In Human Resources

NewsIndustry NewsIndustry NewsHR GeneralistFamily and Medical Leave Act (FMLA)Family and Medical Leave Act (FMLA)USAHR ManagementEnglishFocus AreaHuman Resources
2023-09-06T05:00:00Z
Appellate court sided with employee's (almost) 3-year-delayed FMLA claim
Back in October 2018, Laffon had a medical emergency and needed some time off under the federal Family and Medical Leave Act (FMLA).
Her leave lasted until November 15. Ten days after she returned to work, on November 26, her employer terminated her.
She sued, arguing that the employer retaliated against her because of her FMLA leave.
The catch? She didn't bring the suit until almost three years later.
No link between leave and termination
In court, the employer argued that there was no causal link between Laffon taking FMLA leave and her termination. Although the court documents aren't robust, they do reveal that the employer indicated that Laffon's allegations didn't show that her taking FMLA leave was a factor in the decision to terminate her. The documents showed only that the termination chronologically followed her leave.
The court agreed with the employer. It also agreed that Laffon failed to allege a willful violation of the FMLA, which would allow her to benefit from the FMLA's three-year statute of limitations.
Laffon appealed the case to the Ninth Circuit.
Statute of limitations
Under the FMLA, employees have two years from the date of the last event constituting the alleged violation for which they can bring a claim.
Those two years are extended to three years if the employer's actions were "willful." This means that an employee must show that the employer either knew or showed reckless disregard for whether its conduct violated the FMLA.
Ruling overturned
Fast forward to August 2023, when the Ninth Circuit reversed the lower court's decision. It indicated that, based on Laffon's amended complaint and liberally construing the law, her allegations establish that her leave was causally connected to her termination and that the employer's action (her termination) was willful.
Glymph v. CT Corporation Systems, No. 22-35735, Ninth Circuit Court of Appeals, August 22, 2023.
Key to remember: Terminating an employee soon after returning from FMLA leave is risky, unless there is a clear, well-documented, non-leave-related reason. Case documents did not show such a clear reason, which can also increase the risk of a willful finding. Employees have time to file claims, even years.

NewsIndustry NewsRecordkeepingRecordkeepingHR GeneralistFamily and Medical Leave Act (FMLA)In-Depth ArticleFamily and Medical Leave Act (FMLA)HR ManagementEnglishUSAFocus AreaHuman Resources
2026-05-20T05:00:00Z
Do the FMLA notices and certifications expire in June?
The answer to that question for employers is, “No.” The answer to that question for the U.S. Government’s Office of Management and Budget (OMB), however, is, “Yes.”
Employers might notice that the following federal Family and Medical Leave Act (FMLA) documents from the U.S. Department of Labor (DOL) have an expiration date listed as “6/30/26” in the upper right-hand corner:
- WH-381: Eligibility/Rights and Responsibilities Notice
- WH-382: Designation notice
- WH-380-E: Certification of an employee’s serious health condition
- WH-380-F: Certification of a family member’s serious health condition
- WH-384: Certification of a qualifying exigency
- WH-385: Certification for military caregiver of a current military member
- WH-385-V: Certification for military caregiver of a veteran
This, however, doesn’t mean that employers aren’t allowed to use these forms after that date. They may. Employers and employees are allowed to use the current forms beyond that date because the content remains applicable under FMLA law.
The June 30, 2026, date on the FMLA notices and certification forms, doesn’t represent a deadline for FMLA leave itself. It’s the OMB’s expiration date for the forms’ collection and recordkeeping requirements, not the end of the forms’ legal validity.
What the date means
These government documents are subject to certain checks and balances, such as the following:
- OMB control number 1235‑0003 governs the collection of information from employers and employees for DOL compliance purposes.
- The June 30, 2026, date is when the latest version of the forms will be replaced by a new OMB‑approved version.
The OMB has to review the FMLA notices and certification forms every 3 years. The last time it did so, it didn’t make any material changes.
The OMB is part of the U.S. Executive Office and helps the president meet policy and budget, manage details, oversee regulatory objectives, and helps fulfill the agency’s statutory responsibilities.
Model forms optional
Employers aren’t required to use the DOL’s model forms. Many do, however, because it’s easier than creating their own forms. Using the DOL’s forms also helps ensure the notices provide enough information and the certifications don’t ask employees for information beyond what the FMLA allows.
Key to remember: The June 30, 2026, expiration date of FMLA documents is just a form‑collection deadline, not a legal cutoff for FMLA leave or certification. Employers may still use the current forms until a new version is issued.
NewsRecruiting and hiringChange NoticesChange NoticeMaineApplications/ApplicantsLabor Law PostersLabor Law PostersEnglishFocus AreaTalent Management & RecruitingHuman Resources
2026-07-16T05:00:00Z
Maine employers using electronic surveillance must provide notice
This applies to: Maine employers using electronic surveillance
Description of change: Maine employers using electronic surveillance must inform prospective employees during the employment interview process that the employer uses electronic surveillance. Written notice must also be provided at least annually to all employees.
"Employer surveillance" is defined as the monitoring of an employee by an employer through the use of an electronic device or system, including but not limited to the use of a computer, telephone, wire or radio, or an electromagnetic, photoelectronic, or photo-optical system. It doesn’t include an employer's use of surveillance cameras for security or safety purposes or the use of global positioning system tracking or other safety devices on vehicles owned by the employer. An employer may not use audiovisual monitoring in an employee's residence or personal vehicle unless required by job duties.
An employer that violates the Employer Surveillance law is subject to a fine of at least $100 and not more than $500 for each violation.
View related state info: Employee notices - Maine
NewsFamily and Medical Leave Act (FMLA)LeaveTime offFamily and Medical Leave Act (FMLA)HR ManagementEnglishLeaveAssociate Benefits & CompensationChange NoticesChange NoticeCaliforniaHR GeneralistAssociate RelationsFocus AreaHuman Resources
2026-07-15T05:00:00Z
California adds paid maternity leave for community college district academic employees
Effective date: January 1, 2027
This applies to: Community college districts in California
Description of change: Academic employees or employees in the classified service of the community college district are entitled to up to 14 weeks of paid leave for pregnancy, miscarriage, childbirth, termination of pregnancy, or recovery from those conditions.
Employees don’t have any other eligibility requirements, including, but not limited to, minimum hours worked or length of service, before an employee disabled by pregnancy, childbirth, termination of pregnancy, or related medical conditions is eligible for the paid leave.
Employees may begin taking the paid leave before and continue after childbirth if the employee is actually disabled by pregnancy, childbirth, termination of pregnancy, or a related condition.
The leave wouldn’t run concurrently with other forms of leave.
Community college districts must maintain group health coverage during leave at the same level and under the same conditions that coverage would have been provided if the employee hadn’t taken the leave.
The employee would be paid during the leave, including retirement fund contributions required by the community college district. Employees earn full-service credit during the leave of absence and must pay member contributions to the retirement fund.
View related state info: FMLA - California

NewsIndependent ContractorsContingent WorkforceFamily and Medical Leave Act (FMLA)Family and Medical Leave Act (FMLA)USAHR ManagementEnglishAssociate Benefits & CompensationIndustry NewsIndustry NewsWage and HourContingent WorkforceWage and HourHR GeneralistFair Labor Standards Act (FLSA)OvertimeAssociate RelationsFocus AreaHuman Resources
2026-07-06T05:00:00Z
Wage and Hour Division publishes its 2026 regulatory agenda
On July 6, the U.S. Department of Labor’s (DOL) Wage and Hour Division (WHD) published its 2026 unified regulatory agenda. The agenda offers a glimpse into what the WHD is planning for its regulations and when.
Joint employer proposed rule: July 2026
Since 2021, the WHD has had no regulatory guidance addressing joint employer liability under the Fair Labor Standards Act (FLSA). The WHD is considering a proposed rule to adopt regulations that would guide WHD enforcement of joint employer liability under the FLSA, the Family and Medical Leave Act (FMLA), and the Migrant and Seasonal Agricultural Workers Protection Act (MSPA). The WHD says that joint employer status under the FMLA and MSPA should be determined using the FLSA analysis.
When a rule is earmarked in the regulatory agenda as a “proposed rule,” that means the public expects to see written documentation on which they can provide their comments. The agencies involved then review the comments, and the rule moves to the next step in the legislative process. The dates listed are estimates that the agencies think they’ll have something posted for review.
Independent contractor final rule: October 2026
In 2024, the WHD published a final rule providing an analysis for determining employee or independent contractor (IC) classification under the FLSA. The 2024 IC rule took effect on March 11, 2024. The 2024 IC rule, however, is the subject of legal challenges. The WHD intends to rescind the 2024 IC rule. The WHD has also proposed to modify regulations interpreting the FMLA and MSPA to clarify that the analysis for determining employee or IC status under the FLSA also applies under the FMLA and MSPA.
The WHD considered three alternatives to the proposed rule, listed below from least to most restrictive:
- Adopting the common law control test, which applies in distinguishing between employees and ICs under various other federal laws;
- Adopting the WHD’s current enforcement policy, which is comprised of sub-regulatory guidance from before 2021 applying a multifactor economic reality balancing test; and
- Adopting a 3-pronged “ABC” test (which several states have adopted).
The WHD issued a proposed rule in February 2026, and the comment period ended on April 28.
A final rule addresses the public comments submitted in response to a proposed rule to help determine the final regulatory language. When an agency publishes a final rule, generally the rule is effective no less than 30 days after the date of publication in the Federal Register. A final rule doesn’t take effect until its “effective date” is reached.
Key to remember: The Wage and Hour Division is looking to revise the joint employer and independent contractor regulations.

NewsIndustry NewsHR GeneralistFamily and Medical Leave Act (FMLA)In-Depth ArticleFamily and Medical Leave Act (FMLA)HR ManagementEnglishUSAFocus AreaHuman Resources
2024-05-07T05:00:00Z
May employees take FMLA leave to care for family members outside the U.S.?
Yes, employees may take leave under the federal Family and Medical Leave Act (FMLA) to care for family members who are outside U.S. borders.
If the employee meets the eligibility criteria of the FMLA, the family member has an FMLA serious health condition, and the employee is needed to care for the family member, the employee’s time off would be protected. It doesn’t really matter where the family member is.
To figure out whether the family member’s condition meets the criteria under the FMLA, employers may require that the employee provide a certification supporting the leave.
Certifications in other languages
If an employee or a family member is visiting in another country, or a family member lives in another country, and a serious health condition develops, employers must accept a medical certification from a health care provider who practices in that country. This rule applies to an original certification, a recertification, and when requesting a second or third opinion from a provider.
If a certification by a health care provider from another country is in a language other than English, employers may require that the employee provide a written translation of the certification.
Traveling to care for family member
If family members are outside the U.S., employees will need to spend some time traveling. The employee’s travel time would likely be seen as part of the FMLA leave if:
- The travel is so intertwined with the care, or
- If it is needed to obtain the care.
Handling intermittent leave
Employees may also take intermittent FMLA leave to care for far-away family members. Employers would manage such leave the same way they do for intermittent leave inside the U.S. Employers should:
- Give the employee an eligibility/rights & responsibilities notice within five days of being put on notice,
- Ask for a certification if desired (including a translation),
- Give the employee a designation notice within five days of getting enough information, and
- Track the employee’s leave time.
Whenever employees are away from the physical worksite, tracking how much intermittent FMLA leave they are taking has its own challenges. Employers may use a simple honor system of self-reporting or technology to keep track of when the employee is taking FMLA leave and when the employee is working.
Key to remember: Eligible employees may take FMLA leave to care for family members who are outside the U.S.
Most Popular Highlights In Safety & Health

NewsIndustry NewsElements of a General Duty Clause ViolationSafety & HealthConstruction SafetyGeneral Industry SafetyAgriculture SafetyMaritime SafetyGeneral Duty ClauseGeneral Duty Clause Enforcement AreasIn-Depth ArticleEnglishGeneral Duty ClauseFocus AreaUSA
2026-07-10T05:00:00Z
Don’t forget the General Duty Clause when identifying workplace hazards
What do heat stress, ergonomics, and struck-by hazards have in common? When employees aren’t adequately protected from these and other serious, recognized hazards for which there’s no OSHA standard, the agency can use the General Duty Clause (GDC) to cite employers. However, the agency must prove four things:
- That a hazard exists,
- That it’s recognized,
- That it’s causing or likely to cause serious physical harm or death, and
- That feasible abatement is available.
As an example, a hazard exists when employees work in extreme heat. It’s recognized because the hazard is widely known by employers, safety professionals, and industry. Extreme heat can pose harm because employees are at risk of heat illness or even death. And, it can be feasibly abated by providing water, rest breaks, and shade. Without all four of these elements, OSHA can’t use the GDC. But when they’re present, it’s a strong enforcement tool.
Recognized hazards
OSHA determines whether a hazard is “recognized” by looking at several sources, including:
- Industry consensus standards like the American National Standards Institute (ANSI) or the National Fire Protection Association (NFPA);
- An employer’s own safety rules and training materials;
- Previous incidents involving the hazard; and
- Industry recognition of the hazard, such as statements by safety or health experts who are familiar with the relevant conditions, and evidence of implementation of abatement methods to deal with the particular hazard by other members of the employer's industry.
Examples of recognized hazards include:
- Employees operating forklifts without wearing available seat belts;
- Damaged warehouse racks that could collapse;
- Workplace violence risks in certain settings, such as healthcare or gas stations, where the hazard is well documented; and
- Employees riding on the exterior rear step of refuse-collection trucks while vehicles are in transit.
Struck-by hazards and combustible dust are also recognized hazards. Recent cases where OSHA cited the GDC include:
- Employees walking in poorly illuminated areas on a jobsite where heavy vehicle traffic was present, and
- Employees exposed to fire and explosions associated with combustible dust generated during the manufacturing of dietary supplements.
Ergonomic hazards include strain from activities such as lifting, pushing, or repetitive motion. Musculoskeletal disorders (MSDs) like tendonitis, carpal tunnel syndrome, and back injuries can result from these exposures.
Identifying and controlling recognized hazards
A proactive approach is the best defense against a GDC citation. Conducting a job hazard analysis (JHA) helps identify hazards that might otherwise be missed. Observe employees as they perform tasks and ask for their input. They may identify hazards that employers or safety professionals don’t recognize, especially with tasks that occur infrequently or only under specific conditions.
In addition to JHAs, reviewing injury and illness records, near-miss reports, incident investigations, equipment manuals, workers’ compensation claims, industry guidance, and consensus standards can also provide insights.
Once you identify hazards, determine which ones don’t have an OSHA standard, like heat or ergonomics, and prioritize those that could cause serious physical harm or death. Consider the hierarchy of controls and whether the hazard can be eliminated or reduced.
Put reasonable controls in place (such as water, rest breaks, and shade for heat, or lift-assist devices for repeated manual lifting) and keep records showing what’s been done. Documented JHAs, training records, inspection logs, and corrective action reports can all help show that you took the hazard seriously and acted to protect employees.
The GDC and “inherently risky professions”
On July 1, 2025, OSHA issued a proposed rule that would limit the scope of the GDC. If finalized, OSHA could no longer use the GDC to cite employers of “inherently risky professions,” which includes such activities as motor sports, animal handling and performance, and combat simulation training. (See our related article, “OSHA proposes giving employers with ‘inherently risky professions’ a free pass.”) The agency’s most recent regulatory and deregulatory agenda, published July 3, 2026, reveals OSHA intends to hold public hearings on the proposal starting mid-August.
Key to remember: OSHA uses the General Duty Clause to cite serious, recognized hazards for which there’s no OSHA standard. When you identify and control these hazards and document your actions, OSHA may find it more difficult to establish the four elements necessary for a GDC citation.

NewsIndustry NewsIndustry NewsEnforcement and Audits - OSHAEnforcement and Audits - OSHASafety & HealthConstruction SafetyGeneral Industry SafetyMaritime SafetyOccupational Safety and Health Administration (OSHA), DOLEnglishFocus AreaUSA
2026-07-06T05:00:00Z
OSHA publishes long-awaited Regulatory Agenda
After failing to publish a Fall 2025 or Spring 2026 regulatory agenda, on July 3 OSHA published a 2026 Regulatory Plan and the Unified Agenda of Federal Regulatory and Deregulatory Actions. Of note, a Subpoenas interim final rule is up for November 2026, the Emergency Response final rule is set for April 2027, and the Heat proposal is slated to be finalized in October 2027.
Starting August 19, 2026, OSHA will hold public hearings on numerous proposed rules, most of which relate to respiratory protection requirements for different chemical substances. The others relate to construction illumination, safety color code for marking for physical hazards, limiting the General Duty Clause for inherently risky professional activities, and fixed ladders.
Four rules fell into the long-term action category from the proposed or final stages in 2025: Communication Tower Safety, Shipyard Fall Protection, Powered Industrial Trucks Design Standard Update, and Standards Improvement Project. Long-term actions are items the agency considers under development but does not expect to take regulatory action on within 12 months after publication of the most recent regulatory agenda.
| Final rule stage | |
| Projected publication date | Title |
| July 2026 |
|
| September 2026 |
|
| November 2026 |
|
| April 2027 |
|
| October 2027 |
|
| Proposed rule stage | |
| Projected publication date or other action | Title |
| July 2026 |
|
| August 2026 - public hearings |
|
| September 2026 |
|
| November 2026 |
|
| December 2026 - Supplemental Notice of Proposed Rulemaking |
|
| Long-term actions | |
| |

NewsIndustry NewsMaterials Handling and StorageSafety & HealthConstruction SafetyGeneral Industry SafetySlings for Materials HandlingIn-Depth ArticleEnglishFocus AreaUSA
2026-07-09T05:00:00Z
When the sling is the weak link
A dropped load can change a workday in seconds. In material handling, we often focus on the crane, hoist, forklift, or equipment doing the lifting, but the sling is what connects the load to the lift. If the connection fails, it can create a serious struck-by or caught-between hazard that may result in damaged equipment, production delays, serious injuries, or even fatalities.
Sling safety must start before the load leaves the ground. One missed detail, such as a damaged sling, unreadable tag, wrong hitch, or underestimated load weight, can be enough to turn a planned lift into an emergency.
Where lifting risks begin
They often build from small decisions that seem harmless at the time: using a sling “just one more time,” assuming the load weight is close enough, ignoring a worn edge, or grabbing whatever sling is nearby because the job needs to keep moving.
Slings aren’t all designed for the same conditions. Alloy steel chain, wire rope, synthetic web, synthetic round slings, metal mesh, and fiber rope all have different strengths, limits, and inspection concerns. A sling that works well for one task may be a poor choice for another if the load has sharp edges, high heat, chemical exposure, abrasion points, or an unstable center of gravity.
Additionally, many incidents lead back to load control. A suspended load does not have to fall straight down to hurt someone. It can swing, shift, rotate, pinch, or strike nearby workers if the lift is not planned and controlled.
Controls that help keep the load secure
Those risks are why the inspection and planning steps cannot be treated as a quick formality. Before the hook is raised, the crew needs to confirm that the sling fits the load, the conditions, and the way the load will move. OSHA’s sling requirements for general industry are found in 1910.184, and construction rigging requirements are addressed under 1926.251, but the practical goal is the same: use a sling that is suitable, inspected, properly identified, and within its rated capacity.
A stronger lift starts with slowing down long enough to answer a few basic questions during the setup:
- Load planning: Confirm the weight, center of gravity, attachment points, hitch type, sling angle, and travel path at the planning stage. Guessing may feel faster, but it removes the safety margin the lift depends on.
- Sling inspection: Look for cuts, burns, broken wires, crushed areas, stretched links, chemical damage, corrosion, damaged stitching, knots, or hardware that does not match the sling’s capacity. If the sling is damaged, questionable, or missing required identification, remove it from service.
- Edge and surface protection: Protect slings from sharp, rough, or abrasive load edges that can cut, crush, or wear down the material once tension is applied. Padding, sleeves, corner protectors, or a different sling type may be needed based on the load and conditions.
- Worker positioning and communication: Keep employees clear of areas where the load could swing, shift, or fall. Use clear signals, taglines when appropriate, and stop the lift if conditions change or communication breaks down.
The compliance side of sling safety
The requirements should show up in everyday lifting practices, not just in the written program. Slings must be inspected before use, damaged or defective slings must be removed from service, and slings must not be loaded beyond their rated capacity. In construction, rigging equipment must also have permanently affixed and legible identification markings that show the recommended safe working load, and equipment without those markings cannot be used.
The tag matters. The condition matters. The configuration matters. And the person selecting and using the sling needs to understand how those pieces work together while the load is still on the ground.
Key to remember: Every lift depends on using the right sling the right way. Confirm that it is rated, marked, and protected from damage, and keep employees clear of the suspended load.

NewsIndustry NewsSafety & HealthConstruction SafetyInjury and Illness Recording CriteriaGeneral Industry SafetyIn-Depth ArticleUSAEnglishFocus AreaInjury and Illness Recordkeeping
2023-10-18T05:00:00Z
Can I get a second opinion? I want to delete an OSHA recordable
Getting a second opinion regarding an injured employee’s need for medical treatment, restrictions, or days away might allow an employer to avoid recording the incident on the 300 Log, but OSHA does impose some limitations.
Normally, a mere recommendation for medical treatment, restrictions, or days away makes a case recordable, even if the employee does not to follow that recommendation. However, OSHA allows employers to avoid recording an incident based on a “contemporaneous” second opinion that is more “authoritative.” If the employee receives medical treatment, however, a second opinion cannot negate the obligation to record the case.
Contemporaneous defined
OSHA does not define “contemporaneous” in the regulations, but offered clarification in a letter of interpretation (LOI) dated May 15, 2007. The evaluations must be conducted when the signs or symptoms are in the same stage of development, same degree of severity, and the condition is evaluated in similar context.
Opinions obtained on the same day would be contemporaneous. Acceptable time delays may differ depending on circumstances, including the type and severity of the condition. For instance, if the employee’s condition either improved or worsened between examinations, the condition would not be evaluated at the same stage.
An employer presented a scenario in an LOI dated September 24, 2010. An employee fell from a chair, went to the emergency room, and was given restrictions that did not affect his duties. Ten days later, the employee visited an occupational clinic and was released to full duty. Finally, after another four days (14 days after the initial ER visit), the employee visited a chiropractor who recommended days away. The employer wanted to consider the initial opinions as more “authoritative” to avoid recording days away. However, OSHA noted that the opinions were not contemporaneous so the question of authority was moot. The employer had to record the case. The employee’s injury might have worsened due to activities outside work, but since the condition started at work, OSHA considers it work-related.
In another LOI dated February 25, 2011, OSHA offered additional considerations regarding “contemporaneous” opinions to include:
- Whether the examination was in person (reviewing documents is not sufficient);
- Whether the examinations were done on the same day;
- Whether the employee was subjected to additional events or exposures between the examinations; and
- Whether medical treatment, restricted work activity, or days away occurred between the examinations.
Authoritative defined
The regulation at 1904.6(b)(3) defines “authoritative” as the “best documented, best reasoned, or most authoritative.” The 2010 LOI mentioned previously clarifies that the most authoritative opinion is “the best documented, the best reasoned, or the most persuasive.”
OSHA allows employers to make that determination. In fact, the preamble published in 2001 says, “the rule requires the employer to rely on the one judged by the employer to be most authoritative.” Also, a frequently asked question in OSHA’s Recordkeeping Policies and Procedures Manual (CPL 02-00-135) states, “the employer may determine which recommendation is the most authoritative and record on that basis.”
So, if an injured employee gets a recommendation for medical treatment, restrictions, or days away, but the employer obtains a contemporaneous opinion contradicting that recommendation and the second opinion is more authoritative, the employer may follow the second opinion. However, once medical treatment is provided, the employer must record the case. A subsequent recommendation cannot “undo” a recommendation that was already followed or implemented.
Key to remember: Employers can record cases based on second opinions if the evaluation was both contemporaneous and more authoritative.

NewsIndustry NewsWhistleblower RetaliationWhistleblower Protection ProgramSafety & HealthConstruction SafetyGeneral Industry SafetyIn-Depth ArticleEnglishFocus AreaUSA
2024-03-18T05:00:00Z
Can you fire someone who got injured? Yes, if you do it correctly
Consistently enforcing safety policies is the key to firing unsafe employees. Employers can’t fire an employee for getting injured, but they can discipline employees for violating documented safety rules or policies.
A common problem is that employers (and especially supervisors) don’t consistently follow the company’s disciplinary process for safety violations. Then, when someone gets injured, they want to impose discipline or termination. This can create the impression that the employee was disciplined “because of the injury” or “because of the workers’ compensation claim.”
Employee rights
The OSHA regulation at 1904.35 says that employers can’t discharge or discriminate against employees for reporting a work-related injury or illness. From a workers’ comp standpoint, imposing discipline can create the impression of retaliation for filing a claim (which is a worker’s right).
To illustrate, suppose an employee frequently removes his hard hat. The supervisor is inconsistent about addressing this and never documents any reminders given. Eventually, the employee gets a head injury that would have been prevented by the hard hat. The supervisor wants to fire the worker for the repeated safety violation.
If the terminated employee files an OSHA whistleblower claim or a workers’ comp retaliation claim, he’ll likely say that he was disciplined for reporting the injury or filing the claim. The company will have a chance to refute the claim, but this can be challenging when there’s little or no documentation of a recurring problem.
For related information, see Preventing Retaliation: OSHA's Whistleblower Protection Program.
Justifying the adverse action
If the company consistently enforces its rules (with documentation), then a termination should be easier to justify. An investigator might ask questions like:
- What is your policy on disciplining employees for safety violations?
- If the policy says that a second warning will be in writing and a third violation will result in termination, do you have documentation of previous warnings?
- Have you disciplined or terminated employees for safety violations even if they didn’t get injured?
If the company can’t show that it consistently enforces safety rules (regardless of injuries) then firing an employee who got injured can look like unlawful retaliation.
To use the hard hat example again, suppose the supervisor issued a verbal warning on June 14 and documented (for the supervisor’s own records) that she issued a verbal warning. On August 24, the supervisor issued a written warning to the same employee about not wearing a hard hat. Finally, on October 10, the employee got injured while not wearing a hard hat. If the policy says that a third violation results in termination, the employee can be fired, regardless of the injury. If the employee files a retaliation claim, the termination should be more defensible.
Follow the policy
Now, a company policy might not stipulate termination after the third warning. Maybe that’s the fourth step after a verbal warning, written warning, and suspension. Also, safety disciplinary policies sometimes have time limits, like all warnings must occur within a rolling 24-month period, so supervisors aren’t looking back many years for previous warnings.
For potentially life-threatening violations (like working at heights without fall protection) a policy might start with a written warning or suspension, then termination on the second violation. Employers can choose to apply different standards based on the seriousness of the violation. But once established, supervisors must enforce the policy consistently and document all warnings.
Key to remember: It’s not against the law to fire an employee who got injured if employers consistently follow their enforcement policies. However, employers cannot fire an employee “because of” the injury or for reporting an injury.
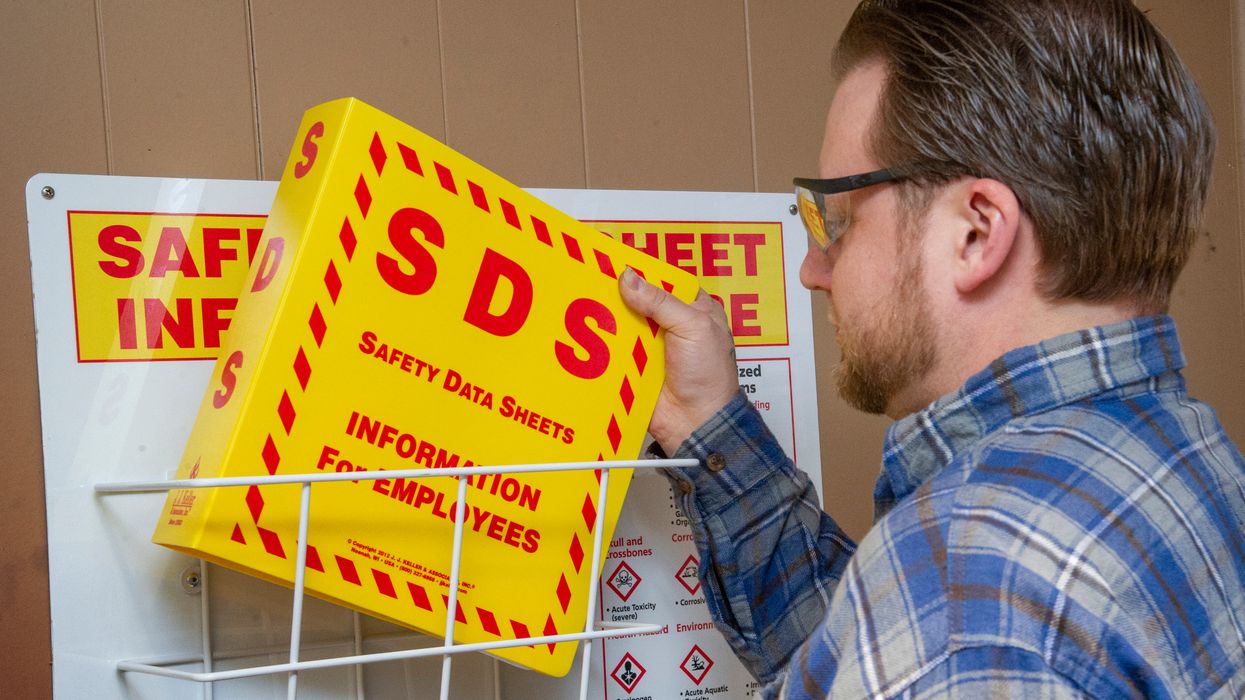
NewsSafety Data SheetsIndustry NewsIndustry NewsEnglishHazard ClassificationsSafety & HealthGeneral Industry SafetyOccupational Safety and Health Administration (OSHA), DOLHazard CommunicationHazard CommunicationHazcom LabelingFocus AreaUSA
2026-05-12T05:00:00Z
First HazCom compliance date almost here!
OSHA’s revised Hazard Communication (HazCom) standard, which took effect in July 2024, includes staggered compliance dates stretching into 2028. The first of these is just around the corner. By May 19, 2026, chemical manufacturers, importers, and distributors evaluating substances must be in compliance with all modified provisions of the standard. (“Substance” is defined in 1910.1200(c).) This means manufacturers and importers must reclassify aerosols, desensitized explosives, and flammable gases under the new criteria in Appendix B to 1910.1200 and make corresponding changes to safety data sheets (SDSs) and labels.
Additionally, these manufacturers, importers, and distributors must comply with changes to the following elements, as applicable:
- Labels for packages released for shipment, bulk shipments, and small containers;
- SDS subsections; and
- Trade secrets.
Downstream users of substances that are aerosols, desensitized explosives, or flammable gases will start to see updated SDSs and labels on shipped containers of hazardous chemicals (if they haven’t already). For more information, see our related FAQ.
Saved to my EVENT CALENDAR!
View your saved links by clicking the arrow next to your profile picture located in the header. Then, click “My Activity” to view the Event Calendar on your Activity page.
OK
J. J. Keller is the trusted source for DOT / Transportation, OSHA / Workplace Safety, Human Resources, Construction Safety and Hazmat / Hazardous Materials regulation compliance products and services. J. J. Keller helps you increase safety awareness, reduce risk, follow best practices, improve safety training, and stay current with changing regulations.
Copyright 2026 J. J. Keller & Associate, Inc. For re-use options please contact copyright@jjkeller.com or call 800-558-5011.