Compliance Just Got Easier: Stay ahead of regulatory changes with instant notifications on updates that matter.
['Enforcement and Audits - OSHA', 'Hazardous Materials Safety - OSHA']
['OSHA Inspections', 'Process Safety Management', 'OSHA Emphasis Programs']
2023-08-18T05:00:00Z
JOIN TODAY TO CONTINUE READING THIS ARTICLE & OTHER INDUSTRY NEWS!
You'll also get exclusive access to:
A database of easy-to-understand regulationsAsk unlimited questions to our expertsPre-led discussions forumsAnd more
TRY IT FREE TODAY
Already have an account? Log in now.

Copyright 2026 J. J. Keller & Associate, Inc. For re-use options please contact copyright@jjkeller.com or call 800-558-5011.
NewsProcess Safety ManagementEnforcement and Audits - OSHAIn-Depth ArticleEnglishOSHA Emphasis ProgramsIndustry NewsOSHA InspectionsSafety & HealthConstruction SafetyGeneral Industry SafetyAgriculture SafetyMaritime SafetyHazardous Materials Safety - OSHAFocus AreaUSA
They’re back! Whopping 31 percent hike in OSHA inspections
2023-08-18T05:00:00Z
You might say OSHA is getting back to its old self again! Inspectors came out strong in fiscal year (FY) 2022, much like the pre-pandemic years. With a hefty budget and less call for inspectors to hunker down at home, the agency conducted 31,820 total inspections, or a 30.8 percent spike from FY 2021!
That’s the latest news from a just-issued Annual Inspection Activity report from federal OSHA that offers the enforcement data for October 1, 2021, to September 30, 2022, or FY 2022. The data does not count the inspections conducted by states and jurisdictions operating state plans.
| See our related article, “Five questions and answers about the OSHA inspection process” (03/07/2023). Also visit our ezExplanation “Inspections under OSHA.” |
In FY 2023, federal OSHA is working on 6 percent more inspections, for a total target of 33,790. Enforcement units would remain relatively unchanged at 60,179.
What else is in the report?
The report offers the break-downs for:
- Total programmed inspections — Inspections kicked off by national, regional, or local emphasis programs. These inspections direct enforcement resources to industries and operations where known hazards exist, such as COVID-19, silica, combustible dusts, chemical processing, and falls in construction.
- Total unprogrammed inspections — Inspections prompted by imminent danger, fatalities, catastrophes involving the hospitalization of three or more employees, injuries/illnesses, employee complaints, referrals, or other inspections.
- Enforcement units— Units calculated to give more weight to complex enforcement activities that focus on the most hazardous workplaces and operations. Examples include process safety management, combustible dust hazards, fatality/catastrophe cases, trenching, electrical hazards, and fall hazards.
How did the inspection data shake out?
Looking at the table, you can see that total inspections dropped in FYs 2020 and 2021 but have rebounded in FY 2022. Programmed inspections for FY 2022 made up 44 percent of all inspections. Unprogrammed inspections, however, dominated with 56 percent of all inspections. Of the unprogrammed inspections:
- Employee complaints drew the most, with 38.3 percent;
- Referrals came in second with 34.3 percent;
- Fatality/catastrophe inspections took 6.3 percent; and
- Other unprogrammed inspections held the remaining 21.1 percent.
| Statistic | FY 2017 | FY 2018 | FY 2019 | FY 2020 | FY 2021 | FY 2022 |
| Total inspections | 32,408 | 32,023 | 33,393 | 21,710 | 24,333 | 31,820 |
| Total programmed inspections | 14,377 | 13,956 | 14,900 | 8,729 | 10,584 | 14,081 |
| Total unprogrammed inspections | 18,031 | 18,067 | 18,493 | 12,981 | 13,749 | 17,739 |
| Fatality/catastrophe inspections | 837 | 941 | 919 | 1,498 | 1,386 | 1,119 |
| Complaint inspections | 8,249 | 7,489 | 7,391 | 4,592 | 4,955 | 6,789 |
| Referral inspections | 6,286 | 6,463 | 6,718 | 4,810 | 5,310 | 6,091 |
| Other unprogrammed inspections | 2,659 | 3,174 | 3,465 | 2,081 | 2,098 | 3,740 |
What about the enforcement units?
The agency explains that the OSHA Weighting System (OWS) replaced the Enforcement Weighting System in FY 2020. Following completion of its third fiscal year, the enforcement portion of OWS is displayed in the table. Comparing the enforcement units (EUs) from FY 2021 to FY 2022, you see that the number of inspections for:
- 7-point EUs for criminal and significant cases went up 59 percent;
- 5-point EUs for cases involving fatalities, catastrophes, chemical plants, and process safety dropped 15.5 percent;
- 3-point EUs for cases involving the focus four hazards rose 24 percent;
- 2-point EUs for cases for time-intensive, high-priority, or novel hazards shot up 57 percent; and
- 1-point EUs for any other cases also climbed 37 percent.
About 18,000 cases involving 1-point EUs (quick and easy inspections) made up 57 percent of the total EU cases for FY 2022. This was followed by over 10,100 cases (or 32 percent) involving 3-point EU cases covering focus-four hazards.
| OWS summary | Weighting system coverage | FY 2020 | FY 2021 | FY 2022 | |||
| Inspections | EU value | Inspections | EU value | Inspections | EU value | ||
| All groups | All inspections | 21,710 | 43,925 | 24,333 | 48,386 | 31,820 | 60,037 |
| Group A – 7 EUs | -Criminal cases -Significant cases | 128 | 896 | 75 | 525 | 119 | 833 |
| Group B – 5 EUs | -Fatalities and catastrophes -Chemical plant NEP and PSM-covered inspections | 1,554 | 7,770 | 1,462 | 7,310 | 1,235 | 6,175 |
| Group C – 3 EUs | -Caught-in hazards, e.g., trenching, equipment operations, oil/gas -Electrical hazards, e.g., overhead power lines, electrical wiring methods -Fall hazards, e.g., scaffolds, elevated walking/working surfaces -Struck-by hazards, e.g., highway work zones, landscaping, material handling | 6,836 | 20,508 | 8,157 | 24,471 | 10,148 | 30,444 |
| Group D – 2 EUs | -Amputation hazards -Combustible dust - Ergonomics -Federal agency inspections -Heat hazards -Non-PEL overexposures - Workplace violence hazards -Permit-required confined space hazards—e.g., grain storage, maritime or construction -Personal sampling, e.g., air contaminants or noise -Site-specific targeting | 1,559 | 3,118 | 1,443 | 2,886 | 2,267 | 4,534 |
| Group E – 1 EU | All other inspections not otherwise listed | 11,633 | 11,633 | 13,196 | 13,196 | 18,051 | 18,051 |
Key to remember
From an OSHA inspection standpoint, the pandemic is no longer a barrier. Inspection counts rebounded in FY 2022. Note that this FY 2023, federal OSHA plans 6 percent more inspections, for a total of 33,790.

NewsProcess Safety ManagementEnforcement and Audits - OSHAIn-Depth ArticleEnglishOSHA Emphasis ProgramsIndustry NewsOSHA InspectionsSafety & HealthConstruction SafetyGeneral Industry SafetyAgriculture SafetyMaritime SafetyHazardous Materials Safety - OSHAFocus AreaUSA
They’re back! Whopping 31 percent hike in OSHA inspections
2023-08-18T05:00:00Z

Written by
Rachel Krubsack
Compliance Expert - EHS
Rachel Krubsack
OSHA 30-hour General Industry Safety and Health, 2023
M.L.I.S. (Master of Library and Information Science), University of Wisconsin-Milwaukee; B.A., Loras College
Compliance Expert at J. J. Keller & Associates specializing in HazCom, OSHA training requirements, and more. Rachel develops content and provides impactful news and regulatory insights.
You might say OSHA is getting back to its old self again! Inspectors came out strong in fiscal year (FY) 2022, much like the pre-pandemic years. With a hefty budget and less call for inspectors to hunker down at home, the agency conducted 31,820 total inspections, or a 30.8 percent spike from FY 2021!
That’s the latest news from a just-issued Annual Inspection Activity report from federal OSHA that offers the enforcement data for October 1, 2021, to September 30, 2022, or FY 2022. The data does not count the inspections conducted by states and jurisdictions operating state plans.
| See our related article, “Five questions and answers about the OSHA inspection process” (03/07/2023). Also visit our ezExplanation “Inspections under OSHA.” |
In FY 2023, federal OSHA is working on 6 percent more inspections, for a total target of 33,790. Enforcement units would remain relatively unchanged at 60,179.
What else is in the report?
The report offers the break-downs for:
- Total programmed inspections — Inspections kicked off by national, regional, or local emphasis programs. These inspections direct enforcement resources to industries and operations where known hazards exist, such as COVID-19, silica, combustible dusts, chemical processing, and falls in construction.
- Total unprogrammed inspections — Inspections prompted by imminent danger, fatalities, catastrophes involving the hospitalization of three or more employees, injuries/illnesses, employee complaints, referrals, or other inspections.
- Enforcement units— Units calculated to give more weight to complex enforcement activities that focus on the most hazardous workplaces and operations. Examples include process safety management, combustible dust hazards, fatality/catastrophe cases, trenching, electrical hazards, and fall hazards.
How did the inspection data shake out?
Looking at the table, you can see that total inspections dropped in FYs 2020 and 2021 but have rebounded in FY 2022. Programmed inspections for FY 2022 made up 44 percent of all inspections. Unprogrammed inspections, however, dominated with 56 percent of all inspections. Of the unprogrammed inspections:
- Employee complaints drew the most, with 38.3 percent;
- Referrals came in second with 34.3 percent;
- Fatality/catastrophe inspections took 6.3 percent; and
- Other unprogrammed inspections held the remaining 21.1 percent.
| Statistic | FY 2017 | FY 2018 | FY 2019 | FY 2020 | FY 2021 | FY 2022 |
| Total inspections | 32,408 | 32,023 | 33,393 | 21,710 | 24,333 | 31,820 |
| Total programmed inspections | 14,377 | 13,956 | 14,900 | 8,729 | 10,584 | 14,081 |
| Total unprogrammed inspections | 18,031 | 18,067 | 18,493 | 12,981 | 13,749 | 17,739 |
| Fatality/catastrophe inspections | 837 | 941 | 919 | 1,498 | 1,386 | 1,119 |
| Complaint inspections | 8,249 | 7,489 | 7,391 | 4,592 | 4,955 | 6,789 |
| Referral inspections | 6,286 | 6,463 | 6,718 | 4,810 | 5,310 | 6,091 |
| Other unprogrammed inspections | 2,659 | 3,174 | 3,465 | 2,081 | 2,098 | 3,740 |
What about the enforcement units?
The agency explains that the OSHA Weighting System (OWS) replaced the Enforcement Weighting System in FY 2020. Following completion of its third fiscal year, the enforcement portion of OWS is displayed in the table. Comparing the enforcement units (EUs) from FY 2021 to FY 2022, you see that the number of inspections for:
- 7-point EUs for criminal and significant cases went up 59 percent;
- 5-point EUs for cases involving fatalities, catastrophes, chemical plants, and process safety dropped 15.5 percent;
- 3-point EUs for cases involving the focus four hazards rose 24 percent;
- 2-point EUs for cases for time-intensive, high-priority, or novel hazards shot up 57 percent; and
- 1-point EUs for any other cases also climbed 37 percent.
About 18,000 cases involving 1-point EUs (quick and easy inspections) made up 57 percent of the total EU cases for FY 2022. This was followed by over 10,100 cases (or 32 percent) involving 3-point EU cases covering focus-four hazards.
| OWS summary | Weighting system coverage | FY 2020 | FY 2021 | FY 2022 | |||
| Inspections | EU value | Inspections | EU value | Inspections | EU value | ||
| All groups | All inspections | 21,710 | 43,925 | 24,333 | 48,386 | 31,820 | 60,037 |
| Group A – 7 EUs | -Criminal cases -Significant cases | 128 | 896 | 75 | 525 | 119 | 833 |
| Group B – 5 EUs | -Fatalities and catastrophes -Chemical plant NEP and PSM-covered inspections | 1,554 | 7,770 | 1,462 | 7,310 | 1,235 | 6,175 |
| Group C – 3 EUs | -Caught-in hazards, e.g., trenching, equipment operations, oil/gas -Electrical hazards, e.g., overhead power lines, electrical wiring methods -Fall hazards, e.g., scaffolds, elevated walking/working surfaces -Struck-by hazards, e.g., highway work zones, landscaping, material handling | 6,836 | 20,508 | 8,157 | 24,471 | 10,148 | 30,444 |
| Group D – 2 EUs | -Amputation hazards -Combustible dust - Ergonomics -Federal agency inspections -Heat hazards -Non-PEL overexposures - Workplace violence hazards -Permit-required confined space hazards—e.g., grain storage, maritime or construction -Personal sampling, e.g., air contaminants or noise -Site-specific targeting | 1,559 | 3,118 | 1,443 | 2,886 | 2,267 | 4,534 |
| Group E – 1 EU | All other inspections not otherwise listed | 11,633 | 11,633 | 13,196 | 13,196 | 18,051 | 18,051 |
Key to remember
From an OSHA inspection standpoint, the pandemic is no longer a barrier. Inspection counts rebounded in FY 2022. Note that this FY 2023, federal OSHA plans 6 percent more inspections, for a total of 33,790.


See More
RELATED NEWS

NewsEnforcement and Audits - OSHAWalking Working SurfacesIn-Depth ArticleUSAEnglishHeat StressOSHA Emphasis ProgramsIndustry NewsHeat and Cold ExposureOSHA InspectionsSafety & HealthConstruction SafetyInfectious DiseasesCOVID-19General Industry SafetyAgriculture SafetyMaritime SafetyStairway Railings and GuidesOSHA RecordkeepingFocus AreaInjury and Illness Recordkeeping
04/17/2026
Expert Insights: From heat to handrails ... OSHA enforcement in transition

NewsEnforcement and Audits - OSHASafety and Health Programs and TrainingSafety and Health Programs and TrainingIn-Depth ArticleEnglishIndustry NewsEnforcement and Audits - OSHAOSHA InspectionsSafety & HealthConstruction SafetyGeneral Industry SafetyAgriculture SafetyMaritime SafetyFocus AreaUSA
06/23/2025
Reading the tea leaves in OSHA’s FY 2026 budget request

NewsIndustry NewsEnforcement and Audits - OSHAOSHA InspectionsSafety & HealthConstruction SafetyGeneral Industry SafetyAgriculture SafetyMaritime SafetyFocus AreaIn-Depth ArticleEnglishOSHA Violations and PenaltiesOSHA Emphasis ProgramsUSA
08/30/2024
Mounting enforcement trends in OSHA state-plan data

Specialized Industries
Go beyond the regulations! Visit the Institute for in-depth guidance on a wide range of compliance subjects in safety and health, transportation, environment, and human resources.
J. J. Keller® COMPLIANCE NETWORK is a premier online safety and compliance community, offering members exclusive access to timely regulatory content in workplace safety (OSHA), transportation (DOT), environment (EPA), and human resources (DOL).

Interact With Our Compliance Experts
Puzzled by a regulatory question or issue? Let our renowned experts provide the answers and get your business on track to full compliance!

Upcoming Events
Reference the Compliance Network Safety Calendar to keep track of upcoming safety and compliance events. Browse by industry or search by keyword to see relevant dates and observances, including national safety months, compliance deadlines, and more.

SAFETY & COMPLIANCE NEWS
Keep up with the latest regulatory developments from OSHA, DOT, EPA, DOL, and more.


REGSENSE® REGULATORY REFERENCE
Explore a comprehensive database of word-for-word regulations on a wide range of compliance topics, with simplified explanations and best practices advice from our experts.

THE J. J. KELLER INSTITUTE
The Institute is your destination for in-depth content on 120+ compliance subjects. Discover articles, videos, and interactive exercises that will strengthen your understanding of regulatory concepts relevant to your business.


ADD HAZMAT, ENVIRONMENTAL, & HR RESOURCES
Unlock exclusive content offering expert insights into hazmat, environmental, and human resources compliance with a COMPLIANCE NETWORK EDGE membership.

DIRECT ACCESS TO COMPLIANCE EXPERTS
Struggling with a compliance challenge? Get the solution from our in-house team of experts! You can submit a question to our experts by email, set up a phone or video call, or request a detailed research report.


EVENTS
Register to attend live online events hosted by our experts. These webcasts and virtual conferences feature engaging discussions on important compliance topics in a casual, knowledge-sharing environment.
Most Recent Highlights In Environmental

NewsIndustry NewsCriteria Air PollutantsEnvironmental Protection Agency (EPA)CAA ComplianceEnvironmentalIn-Depth ArticleFocus AreaEnglishAir PermittingAir ProgramsStationary Emission SourcesUSA
2026-07-29T05:00:00Z
EPA updates preconstruction permitting guidance: What are the impacts on major sources?
Where there’s construction, there are permits, and where there are permits, there are usually delays. For major construction projects in areas with poor air quality, the delay could be due to emission credits. New federal guidance, however, may help reduce those delays.
The Environmental Protection Agency (EPA) recently released guidance clarifying that Nonattainment New Source Review (NNSR) preconstruction permits may be issued to applicants before they obtain the required offsetting emission reduction credits (ERCs) if certain conditions are met.
The new guidance for permitting authorities (usually state or local air agencies) is a change in the agency’s recommended approach, designed to help prevent preconstruction permitting delays for applicants that haven’t yet formally secured ERCs. So, what does this mean for facilities? Let’s take a look!
Which construction projects could be affected?
EPA’s new guidance impacts construction projects in nonattainment areas. These are areas where emissions exceed the National Ambient Air Quality Standards (NAAQS) for any of the six regulated criteria air pollutants.
You need an NNSR permit to build a new major stationary source or make major modifications to an existing major stationary source if:
- The new or modified source is located in a nonattainment area, and
- The new or modified source emits or has the potential to emit a regulated pollutant in amounts that meet the applicable major source or major modification thresholds.
You must obtain an NNSR permit before construction begins. NNSR permits can be issued only if the applicant meets certain conditions, one of which is meeting emission offset requirements.
What are emission offsets?
Emission offsets are reductions in emissions from existing sources that can be used to compensate for emissions from a new or modified source. The Clean Air Act requires new and modified major sources to offset emissions by obtaining sufficient ERCs from existing sources located in the same nonattainment area.
In other words, a new or modified major source must get enough credits from existing nearby sources to cover the total amount of emissions that the facility will add to the area.
How does the guidance impact permitting?
EPA’s previous guidance recommended that NNSR permits generally shouldn’t be issued until ERCs are actually secured. As a result, permitting agencies require applicants to obtain ERCs before issuing an NNSR permit to start construction on a facility, even if the facility won’t immediately begin operations.
Guidance on Clean Air Act Nonattainment New Source Review Emissions Offsets (ERC guidance), issued by EPA on July 1, 2026, changes the agency’s recommended approach. It clarifies that permitting authorities may issue NNSR permits before applicants specifically secure the required ERCs if the permit contains:
- A federally enforceable commitment by the permit applicant to obtain the needed ERCs before starting operations, and
- An express ban on starting operations until the required ERCs are obtained with appropriate permit restrictions on the sources providing the ERCs.
What’s the possible impact on facilities?
Permitting authorities that apply ERC guidance to permitting decisions can issue NNSR permits to qualifying sources before they secure ERCs. This would allow applicants to start construction on or modifications to a major source without delay, provided the enforceable permit conditions are met.
Here's an example:
A business is ready to build a manufacturing plant in a nonattainment area, but operations at the new facility won’t begin until a year after construction is complete.
Under previous guidance, the business couldn’t begin construction on the manufacturing plant until it formally secured the required ERCs upfront for operations that won’t start until a year after the facility is complete.
EPA’s ERC guidance would allow the permitting authority to issue the business an NNSR permit before it obtains the ERCs. That means the business could build the manufacturing plant right away and then secure the ERCs later, closer to the time the facility starts operating.
Keep these points in mind!
Consider the following when determining how EPA’s updated NNSR policy may impact your construction project:
- The ERC guidance is nonbinding, meaning that permitting authorities aren’t required to implement the guidance. Permitting authorities can still require applicants to secure ERCs before issuing NNSR permits.
- Facilities may be able to start construction without first securing ERCs, but facilities can’t begin operating until they secure the required ERCs.
- Most NNSR permits are issued on a state or local level. Confirm the specific requirements that apply to your major source construction project with the relevant state or local permitting authority.
Key to remember: EPA’s guidance allows permitting authorities to issue preconstruction permits for new major sources and major modifications in nonattainment areas before the sources secure emission reduction credits.

NewsIndustry NewsIndustry NewsToxic Substances Control Act - EPAToxic Subtances Control Act - EPATSCA ComplianceToxic Substances - EPAEnvironmental Protection Agency (EPA)EnvironmentalEnglishFocus AreaUSA
2026-07-28T05:00:00Z
EPA extends PCE and CTC compliance deadlines
The Environmental Protection Agency (EPA) has extended the compliance dates of certain Workplace Chemical Protection Program (WCPP) requirements for perchloroethylene (PCE) and carbon tetrachloride (CTC) established under the Toxic Substances Control Act (TSCA).
Published on July 28, 2026, EPA’s final rule changes specific compliance dates but doesn’t alter the underlying WCPP requirements or the agency’s determination that PCE and CTC present unreasonable risks.
Who’s impacted?
The revised deadlines affect facilities subject to the TSCA PCE and CTC risk management rules finalized in 2024. These include entities that manufacture (including import), process, distribute in commerce, use, or dispose of:
- PCE,
- CTC, or
- Products containing PCE or CTC.
What are the new PCE and CTC compliance dates?
EPA’s final rule extends compliance deadlines for various WCPP requirements, including:
- Conducting initial monitoring,
- Meeting the existing chemical exposure limit (ECEL),
- Establishing a regulated area,
- Providing any required respiratory personal protective equipment (PPE) and establishing a respiratory PPE program,
- Implementing a workplace information and training program, and
- Establishing and implementing an exposure control plan (ECP).
Below is a summary of the new compliance deadlines.
| WCPP requirement | New compliance deadline | PCE applicability | CTC applicability |
|---|---|---|---|
| June 21, 2027 | Non-federal facilities | Non-federal facilities |
| September 20, 2027 | Non-federal facilities | Non-federal facilities |
| September 20, 2027 | Federal and non-federal facilities | Non-federal facilities |
| December 20, 2027 | Non-federal facilities | — |
* EPA maintains the CTC rule’s WCPP compliance date of December 3, 2027, for federal and non-federal facilities to establish and implement an ECP.
Key to remember: EPA has extended compliance dates for certain PCE and CTC Workplace Chemical Protection Program requirements into 2027.
NewsHazardous WasteWaste GeneratorsWaste ManifestsWasteEnglishWaste/HazWasteNew MexicoNew Mexico Environment Department (NMED)Waste HandlersChange NoticesChange NoticeWasteWaste ManagementEnvironmentalWaste PermittingFocus AreaWaste Reporting
2026-07-24T05:00:00Z
New Mexico classifies AFFF as hazardous waste
Effective date: August 1, 2026
This applies to: Entities regulated by the New Mexico hazardous waste regulations
Description of change: The New Mexico Hazardous Waste Bureau adopted amendments and a new rule to regulate aqueous film-forming foam (AFFF) containing intentionally added per- and polyfluoroalkyl substances (PFAS).
Changes include:
- Classifying AFFF with intentionally added PFAS as a hazardous waste (subject to New Mexico’s hazardous waste regulations); and
- Establishing regulations for AFFF with intentionally added PFAS, including:
- A periodic inventory of the substance,
- Restricting the use of AFFF to emergency purposes only, and
- Requiring cleanup of discarded AFFF according to the New Mexico Hazardous Waste Act regulations.
Note that the operational restrictions (20.13.3 NMAC) take effect on August 1, 2026, and the disposal and cleanup rules (20.4.1) take effect on December 1, 2026.
Related state info: Hazardous waste generators — New Mexico
NewsGreenhouse GasesAir EmissionsChange NoticesChange NoticeColoradoCAA ComplianceEnvironmentalFocus AreaEnglishAir ProgramsAir Programs
2026-07-24T05:00:00Z
Colorado revises annual emissions reporting requirements
Effective date: July 15, 2026
This applies to: Sources subject to Regulations 3 and 7 annual reporting requirements
Description of change: The Colorado Air Quality Control Commission amended Regulation Numbers 3 and 7. The revisions:
- Remove the duplicate greenhouse gas (GHG) air pollutant emission notice (APEN) reporting requirement for sources required by Regulation Number 22 to report GHG emissions annually;
- Streamline reporting requirements for annual estimated emissions reports required by Regulation Numbers 3 and 7 (for certain non-oil and gas sector sources and for upstream and midstream oil and gas sector sources, respectively) by specifying that their Emissions Reporting Notices (ERNs) will satisfy the requirements to submit revised APENs due to a change in actual emissions or solely before expiration;
- Increase existing fees for APEN submissions, annual emissions, and application processing required by Regulation Number 3; and
- Add a fee for filing ERNs required by Regulation 7 on a per-emission-point basis (with plans to require fees from all annual reporters eventually).
Streamlined reporting begins in 2027 for Regulation Number 7 annual emissions reports for calendar year 2026 emissions. The ERN filing fee for Regulation Number 7 reporters starts with the ERN filed in 2027 for calendar year 2026 emissions.
Related state info: Clean air operating permits state comparison
NewsHazardous WasteWaste HandlersChange NoticesChange NoticeWasteWaste/HazWasteWaste ManagementEnvironmentalNevadaEnglishFocus Area
2026-07-24T05:00:00Z
Nevada revises hazardous waste recycling rules
Effective date: July 1, 2026
This applies to: Facilities and mobile units that manage recyclable materials classified as hazardous waste or hazardous secondary materials
Description of change: The Nevada State Environmental Commission adopted amendments to the hazardous waste recycling program regulations. Changes include:
- Establishing one regulatory regime for facilities managing recyclable materials classified as either hazardous waste or hazardous secondary materials;
- Exempting certain facilities or mobile units from the requirement to obtain a written determination from the Department of Conservation and Natural Resources before construction and providing that such facilities must comply with certain federal requirements, local zoning requirements if applicable, reporting and notification requirements, and other regulations;
- Exempting certain facilities (if they’re subject to local zoning requirements) from prohibitions on the locations where new or expanding stationary facilities that manage hazardous waste may be built; and
- Establishing an annual $5,000 fee for:
- A written determination issued to new facilities or mobile units that the facilities or units will operate for recycling hazardous waste; and
- Existing facilities that recycle certain hazardous waste and are subject to specific federal recycling requirements.
Most Recent Highlights In Transportation
NewsPesticidesPesticidesChange NoticesChange NoticeEnvironmentalPesticide ManagementEnglishMichiganFocus AreaPesticides
2026-07-24T05:00:00Z
Michigan updates fertilizer bulk storage requirements
Effective date: July 2, 2026
This applies to: Commercial bulk fertilizer storage facilities
Description of change: The amendments increase requirements related to physical and structural redundancy, maintenance, and recordkeeping. The rules align with the standards of the Association of American Plant Food Control Officials (AAPFCO) and the regulations established by similarly situated states. Some of the changes include:
- Requiring every storage container to have a liquid level gauging device;
- Requiring storage containers and appurtenances to be fenced, locked, or otherwise secured to protect against vandalism or unauthorized access that could result in a discharge; and
- Allowing alternative diking for large storage tanks that use double steel wall systems.
Further, the rules require the Michigan Department of Agriculture and Rural Development to preapprove the construction of new or the modification of existing containment systems and operational areas.

NewsIndustry NewsEnglishEnvironmental Management SystemsISO 14001Environmental Management SystemsEnvironmentalIn-Depth ArticleLifecycle AnalysisEnvironmental Management SystemsFocus AreaUSA
2026-07-14T05:00:00Z
ISO 14001:2026 arrives: Key changes for environmental management systems
Environmental management has changed significantly since ISO 14001 was last revised in 2015. Climate-related risks, resource constraints, supply chain challenges, and stakeholder expectations have reshaped how organizations manage environmental issues. In response, the International Organization for Standardization (ISO) released ISO 14001:2026, the first major update to the environmental management system (EMS) standard in over a decade.
The revised standard doesn't change the purpose of ISO 14001. Organizations will continue to use an EMS to identify environmental aspects, meet compliance obligations, manage environmental risks, and improve environmental performance. However, the new edition clarifies requirements and places greater emphasis on measurable environmental results. ISO says the revision is intended to better align EMS programs with today's environmental challenges. Organizations certified to ISO 14001 may need to update procedures, documentation, audits, and management reviews.
Why was the standard updated?
When ISO published ISO 14001:2015, many organizations focused primarily on regulatory compliance. While compliance remains a core component of an EMS, environmental managers today face a broader range of issues. Climate impacts, resource availability, supply chain disruptions, and stakeholder expectations can all affect environmental planning and performance. Rather than creating an entirely new framework, the 2026 version largely builds on concepts that already existed in the 2015 edition while expanding and clarifying expectations.
Environmental context receives greater attention
A major theme of the revision is a stronger focus on organizational context. Organizations are expected to look beyond day-to-day compliance activities when identifying environmental risks and opportunities.
The revised standard emphasizes consideration of environmental conditions that may affect the EMS, including climate-related concerns, biodiversity, ecosystem impacts, and natural resource availability. Organizations are expected to evaluate how external issues and stakeholder expectations may influence environmental objectives and planning.
For environmental managers, this may mean expanding annual EMS reviews to evaluate emerging environmental issues that could affect operations, compliance obligations, permit conditions, or environmental objectives.
Change management moves into the spotlight
The revised standard also introduces a more structured approach to managing change. Many organizations already evaluate environmental impacts when making operational changes, but those reviews are often informal.
ISO 14001:2026 expects organizations to plan, manage, and evaluate changes that may affect environmental performance. Examples include:
- Installing new equipment,
- Expanding production capacity,
- Changing raw materials,
- Modifying waste management practices,
- Switching suppliers, and
- Adding new products or processes.
This requirement should sound familiar to many environmental professionals. Operational changes can affect air emissions, waste generation, wastewater discharges, stormwater exposure, and permit applicability. A structured review process can help identify environmental impacts before changes are implemented.
Lifecycle thinking and supply chains gain importance
Lifecycle thinking was already part of ISO 14001:2015, but the revised standard places greater emphasis on it. Organizations are expected to consider environmental impacts throughout the lifecycle of products and services, including activities involving suppliers, contractors, and externally provided products and services.
This requirement doesn't mean organizations are responsible for every environmental impact within their supply chain. Rather, it encourages organizations to understand how purchasing decisions, outsourced activities, and supplier relationships may affect environmental performance.
For some organizations, this could mean greater emphasis on supplier evaluations, procurement procedures, contractor oversight, or product stewardship initiatives.
Leadership involvement becomes more visible
ISO 14001:2026 also strengthens expectations related to leadership accountability. Environmental management is no longer viewed solely as the responsibility of the environmental department.
The revised standard emphasizes visible leadership involvement and broader organizational participation. Environmental responsibilities may extend beyond EHS personnel to departments such as operations, purchasing, engineering, and management. Organizations will need to demonstrate that leadership is actively engaged in environmental planning, resource allocation, and performance evaluation activities.
What should organizations do now?
Although organizations have time to prepare for the transition, environmental managers may want to begin evaluating their programs now. Early reviews can help identify gaps and reduce the likelihood of surprises during future audits.
Questions organizations may want to consider include:
- Does the EMS adequately address climate, resources, and other emerging environmental issues?
- Is there a documented process for evaluating environmental impacts before operational changes are made?
- Are lifecycle considerations incorporated into purchasing and contractor management activities?
- Can leadership involvement be demonstrated through documented actions and decisions?
- Do environmental objectives show measurable performance improvements?
While ISO 14001:2026 is an evolution of the existing standard rather than a complete overhaul, organizations shouldn't assume existing EMS procedures will meet the revised expectations. Environmental managers may want to review how their systems address organizational context, change management, lifecycle considerations, and leadership involvement before their next audit.
Key to remember: For environmental professionals, the revised standard provides an opportunity to strengthen that connection and demonstrate the value that effective environmental management brings to the organization.

NewsWasteTSCA ComplianceWater ProgramsEnvironmental Protection Agency (EPA)CAA ComplianceWater ProgramsCWA ComplianceWaste/HazWasteEnglishAir ProgramsIndustry NewsIndustry NewsWasteEnvironmentalFocus AreaSARA ComplianceAir ProgramsUSA
2026-07-09T05:00:00Z
EPA releases 2026 regulatory agenda
The Environmental Protection Agency (EPA) published the 2026 Agenda of Regulatory and Deregulatory Actions on July 3, 2026. The agenda outlines the agency’s upcoming regulatory actions and their status in the rulemaking process. Many of the proposed and final rules support EPA’s continued deregulatory efforts.
Significant rulemaking on EPA’s docket includes the following:
- Proposing risk management regulations under the Toxic Substances Control Act (TSCA) for various chemical substances, such as formaldehyde, diisodecyl phthalate (DIDP), and diisononyl phthalate (DINP);
- Aligning the definition of “waters of the United States” with the Supreme Court’s Sackett v. Environmental Protection Agency (2023) decision, which narrowed the definition under the Clean Water Act;
- Finalizing the part 2 risk management regulations for asbestos, including use and associated disposal requirements for legacy asbestos, asbestos-containing talc, and asbestos fibers other than chrysotile;
- Repealing the Carbon Pollution Standards (CPS) that limit greenhouse gas emissions from fossil fuel-fired plants (or repealing a narrower set of requirements under the CPS); and
- Establishing a federal permitting program under the Resource Conservation and Recovery Act (RCRA) for the disposal of coal combustion residuals (CCR).
Additionally, EPA continues to conduct rulemaking related to per- and polyfluoroalkyl substances (PFAS), such as:
- Revising existing effluent limitations guidelines and standards (ELGs) to address PFAS discharges from PFAS manufacturing facilities and chromium electroplating facilities;
- Extending the compliance deadlines for Maximum Contaminant Levels established by the National Primary Drinking Water Regulations (NPDWRs) for perfluorooctanoic acid (PFOA) and perfluorooctane sulfonic acid (PFOS); and
- Rescinding the NPDWRs for four PFAS.
This article highlights some of the major rules we’re monitoring closely. You can review the entire agenda to learn about all the rulemakings EPA plans to review, propose, and finalize. Please note that the agenda dates are tentative, indicating when the agency seeks to publish the rulemakings in the Federal Register.
| Final Rule Stage | |
| Projected publication date | Title |
| July 2026 | Reconsideration of the Greenhouse Gas Reporting Program |
| August 2026 | 1-Bromopropane (1-BP); Regulation Under the Toxic Substances Control Act (TSCA) |
| October 2026 | Revisions to Standards for the Open Burning/Open Detonation of Waste Explosives |
| October 2026 | Secondary Lead Smelting: National Emissions Standard for Hazardous Air Pollutants (NESHAP) Technology Review and Reconsideration |
| January 2027 | Listing of Specific PFAS as Hazardous Constituents |
| Proposed Rule Stage | |
| Projected publication date of notice of proposed rulemaking | |
| August 2026 | Improving Recycling and Management of Renewable Energy Wastes: Universal Waste Regulations for Solar Panels and Lithium Batteries |
| September 2026 | Effluent Limitations Guidelines and Standards for the Oil and Gas Extraction Category (40 CFR 435 Subpart E) |
| October 2026 | Effluent Limitations Guidelines and Standards for the Centralized Waste Treatment Category (40 CFR 437) |
| December 2026 | Clean Water Act Hazardous Substance Facility Response Plans; Amendment Reconsideration |
| December 2026 | National Emission Standards for Hazardous Air Pollutants: Stationary Combustion Turbines; Amendments |
| Pre-Rule Stage | |
| Projected publication date or other action | Title |
| January 2027 (final rule) | Risk Management Program, CAA Section 112(r)(7) (Section 610 Review) |
| August 2026 (begin review) | Oil and Natural Gas Sector: Emission Standards for New, Reconstructed, and Modified Sources (Section 610 Review) |

NewsAir QualityStationary Emission SourcesEnforcement and Audits - OSHAToxic Substances Control Act - EPAAir EmissionsSafe Drinking WaterTSCA ComplianceWater ProgramsWater QualityMonthly Roundup VideoCAA ComplianceAir PermittingHazard CommunicationUSAEnglishHeat StressOSHA Violations and PenaltiesIndustry NewsHeat and Cold ExposureSafety & HealthToxic Substances - EPAGeneral Industry SafetyEnvironmentalFocus AreaWater MonitoringHazard CommunicationAir ProgramsExtreme Temperature PreparationVideo
EHS Monthly Round Up - June 2026
In this June 2026 roundup video, we'll review the most impactful environmental health and safety news.
Hi everyone! Welcome to the monthly news roundup video, where we’ll review the most impactful environmental health and safety news. Let’s take a look at what happened over the past month.
OSHA won’t increase its penalty amounts in 2026. The agency is required to annually adjust its penalties for inflation, based specifically on the October Consumer Price Index data released by the Bureau of Labor Statistics. Due to a lapse in funding, BLS did not release the October 2025 data. Because no alternative calculation is allowed, OSHA penalties will remain at the 2025 amounts.
OSHA updated its inspection guidance for the Hazard Communication standard. While the document is geared towards OSHA inspectors, it provides insights for chemical manufacturers, importers, distributors, and employers as to what the agency will look for during an inspection.
OSHA will hold a series of informal, virtual hearings on multiple proposed rules beginning August 19th. The majority relate to respiratory protection requirements for different chemical substances. All of the proposed rules were originally published in the Federal Register on July 1, 2025.
Nevada OSHA published a list of frequently asked questions related to its recently adopted heat illness rule. The state’s rule took effect April 29.
Turning to environmental news, EPA restored emergency-related affirmative defense provisions for Title V operating permits. This allows stationary sources to assert a regulatory affirmative defense for certain air emission violations caused by events beyond their control.
EPA released two proposed rules that would have major impacts on drinking water regulations for PFAS. The agency will accept comments on the proposals until July 20.
And finally, EPA now allows facilities to submit PCB annual reports electronically. Facilities can start with the upcoming report that’s due July 15.
Thanks for tuning in to the monthly news roundup. We’ll see you next month!

NewsIndustry NewsIndustry NewsPesticidesPesticide Registration and LabelingEnvironmental Protection Agency (EPA)EnvironmentalEnglishFocus AreaPesticidesUSA
2026-07-01T05:00:00Z
EPA sets MyPeST compliance reporting deadlines for bilingual pesticide labeling requirements
The Environmental Protection Agency (EPA) published instructions and deadlines for pesticide registrants to report compliance with bilingual labeling requirements in the MyPeST application. The first compliance reporting deadline is July 31, 2026, for pesticide products with the highest toxicity.
Who’s impacted?
Compliance reporting applies to registrants of pesticide products subject to the bilingual labeling requirements established by the Pesticide Registration Improvement Act of 2022 (PRIA 5) amendments to the Federal Insecticide, Fungicide, and Rodenticide Act (FIFRA).
PRIA 5 requires all end-use pesticide product labels to provide Spanish translations of the human health and safety sections by including the translated sections directly on the label or providing a link via scannable technology or other readily accessible electronic methods to the translated sections. EPA allows certain antimicrobial and non-agricultural pesticide products to comply by providing access to Spanish-language Safety Data Sheets instead of direct label translations.
Compliance timelines are based on the type of pesticide and its toxicity category.
What’s required?
Pesticide registrants must report compliance with the PRIA 5 bilingual labeling requirements using EPA’s MyPeST app. The agency recently published detailed reporting instructions in the MyPeST Application User Guide (accessible in the MyPeST app).
EPA also established the following deadlines for reporting compliance in MyPeST:
| Pesticide product type | Bilingual labeling deadline | Compliance reporting deadline |
|---|---|---|
| Restricted use pesticides (RUPs) | December 29, 2025 | July 31, 2026 |
| Non-RUP agricultural products | ||
| Acute Toxicity Category I | December 29, 2025 | July 31, 2026 |
| Acute Toxicity Category II | December 29, 2027 | January 28, 2028 |
| Antimicrobials and non-agricultural products | ||
| Acute Toxicity Category I | December 29, 2026 | January 28, 2027 |
| Acute Toxicity Category II | December 29, 2028 | January 28, 2029 |
| All other pesticide products | December 29, 2030 | January 28, 2031 |
Most Recent Highlights In Safety & Health

NewsIndustry NewsEnvironmental Protection Agency (EPA)Oil Spill PreventionOil Spill PreventionEnvironmentalIn-Depth ArticleCWA ComplianceEnglishFocus AreaUSA
2026-06-30T05:00:00Z
Secondary containment alternative: Does your oil-filled operational equipment qualify?
Facilities that run like a well-oiled machine often rely on just that — operational equipment that stores and uses oil to function (like hydraulic systems). But wherever oil is stored, there’s always the possibility of a leak, and spilled oil can do serious harm, especially if it reaches water.
That’s where the Environmental Protection Agency’s (EPA’s) Spill Prevention, Control, and Countermeasure (SPCC) rule comes in. Usually, regulated facilities must equip oil-filled operational equipment with general secondary containment, which is designed to temporarily hold discharged oil until it can be properly cleaned up. However, some facilities may have another compliance option available.
EPA offers an alternative to secondary containment for qualified oil-filled operational equipment. Let’s take a look at the eligibility criteria and what the other method of compliance requires.
What’s oil-filled operational equipment?
EPA defines “oil-filled operational equipment” at 40 CFR 112.2. Generally, it refers to equipment that has one or more oil storage containers with oil that’s used solely to operate the equipment. Common examples are lubrication systems for pumps and compressors, machining coolant systems, circuit breakers, and electrical switches.
Does your facility have qualified equipment?
Only qualified oil-filled operational equipment is eligible for the alternative requirements to general secondary containment.
The SPCC rule considers oil-filled operational equipment to be qualified if it hasn’t had one discharge of oil exceeding 1,000 gallons or two discharges of oil exceeding 42 gallons each over the following time periods:
- If the facility has operated for at least 3 years, within any 12-month period in the 3 years before the SPCC Plan’s certification date; or
- If the facility has operated for less than 3 years, since becoming subject to the SPCC regulations.
Take note! When determining whether your facility’s oil-filled operational equipment is eligible under federal standards:
- Don’t count oil discharges caused by natural disasters, acts of war, or terrorism; and
- Don’t count the total amount of oil spilled, only the amount that reaches navigable waters or adjoining shorelines.
What about oil-filled manufacturing equipment?
The SPCC rule distinguishes between oil-filled manufacturing equipment and oil-filled operational equipment. Oil-filled manufacturing equipment stores oil only as a supporting element for conducting a mechanical or chemical operation to create or modify a product. It typically involves a flow-through process in which oil continuously moves through the equipment. Examples of this type of equipment include reaction vessels, mixing tanks, and distillation columns.
Because it’s defined independently under the SPCC rule, oil-filled manufacturing equipment isn’t eligible for the alternative compliance option available to qualified oil-filled operational equipment.
What are the alternative measures?
Instead of providing secondary containment for qualified oil-filled operational equipment, facilities may choose to comply with the alternative requirements at 112.7(k), which include:
- Establishing and documenting an inspection or a monitoring program to detect equipment failures and discharges; and
- Adding to the SPCC Plan:
- An oil spill contingency plan according to the requirements of Part 109; and
- A written commitment of the resources (manpower, equipment, and materials) needed to quickly control and remove any potentially harmful quantities of discharged oil.
Take note! If your business must submit a facility response plan (FRP) under 112.20, the oil spill contingency plan and written commitment requirements don’t apply since your FRP already contains these elements.
Why should my facility consider the alternative compliance option?
The alternative requirements to general secondary containment don’t require facilities to prepare an impracticability determination for qualified oil-filled operational equipment.
The impracticability determination provisions at 112.7(d) impose more requirements for facilities that use alternative measures to secondary containment for unqualified equipment. In addition to meeting the same requirements for qualified oil-filled operational equipment, facilities must have the oil spill contingency plan certified by a Professional Engineer (unless self-certifying as a qualified facility). They also must:
- Describe in the SPCC Plan the reasons such measures aren’t practicable, and
- Conduct periodic integrity tests of bulk storage containers and periodic integrity and leak tests of valves and piping.
Key to remember: The SPCC rule offers an alternative to general secondary containment requirements for qualified oil-filled operational equipment.

NewsGreenhouse GasesAir QualityExcavationsToxic Substances Control Act - EPAToxic Subtances Control Act - EPAPersonal Protective EquipmentAir EmissionsTSCA ComplianceExcavationsMonthly Roundup VideoMiningCAA ComplianceUSAEnglishIndustry NewsSafety & HealthConstruction SafetyInfectious DiseasesCOVID-19General Industry SafetyGeneral Duty ClauseSpecialized IndustriesEnvironmentalFocus AreaRespiratory ProtectionMine SafetyGeneral Duty ClauseAir ProgramsVideo
EHS Monthly Round Up - August 2025
In this August 2025 roundup video, we'll review the most impactful environmental health and safety news.
Hi everyone! Welcome to the monthly news roundup video, where we’ll review the most impactful environmental health and safety news. Let’s take a look at what’s happened over the past month!
OSHA extended the comment period for multiple proposed rules it published on July 1. Stakeholders now have an extra 60 days, until November 1, to comment. Impacted rules include those for respiratory protection, construction illumination, COVID-19, and the General Duty Clause.
OSHA is expanding its Voluntary Protection Programs to help employers develop strong safety programs and lower injury rates. To participate, employers must submit an application to OSHA and undergo an onsite evaluation by a team of safety and health professionals.
Following a series of recent trench collapses, OSHA urges employers to take steps to protect workers. Trench collapses can be prevented by sloping or benching trench walls at an angle, shoring trench walls with supports, and shielding walls with trench boxes. More information can be found on OSHA’s website.
The Mine Safety and Health Administration launched a webpage for its new Compliance Assistance in Safety and Health, or CASH, program. The agency anticipates a surge in domestic mining productivity and seeks to proactively provide miners and mine operators with compliance assistance materials.
Turning to environmental news, EPA proposes challenges to California’s Clean Truck Check program. The program aims to reduce emissions of nitrogen oxides and particulate matter for heavy-duty vehicles. EPA supports the regulation as it applies to California-registered vehicles but disapproves the regulation as it applies to out of state and out of country vehicles. Stakeholders have until September 25 to comment on the proposal.
On August 14, EPA released the July 2025 nonconfidential TSCA Inventory of chemical substances manufactured, processed, or imported in the U.S. The Inventory contains over 86 thousand chemicals, nearly half of which are in active use. The next inventory update is planned for late 2026.
And finally, EPA proposes to rescind the 2009 Endangerment Finding and repeal greenhouse gas emissions for new motor vehicles and vehicle engines. The agency will accept comments on the proposal through September 15.
Thanks for tuning in to the monthly news roundup. We’ll see you next month!

NewsHazardous WasteGreenhouse GasesWaste ManifestsWater ProgramsFall ProtectionMonthly Roundup VideoFall Protection for ConstructionCAA ComplianceUSAWater ProgramsWaste/HazWasteEnglishIndustry NewsSafety & HealthConstruction SafetyGeneral Industry SafetyWasteEnvironmentalFocus AreaAir ProgramsVideo
EHS Monthly Round Up - September 2025
In this September 2025 roundup video, we'll review the most impactful environmental health and safety news.
Hi everyone! Welcome to the monthly news roundup video, where we’ll review the most impactful environmental health and safety news. Let’s take a look at what’s happened over the past month.
OSHA released its Spring 2025 regulatory agenda on September 4. Many rulemakings have been pushed into the fourth quarter of 2025 and the first half of 2026, while a few have been removed from the agenda altogether. These include Infectious Diseases, Blood Lead Level for Medical Removal, and the Musculoskeletal Disorders Column on the OSHA 300 log.
Three rules moved into the long-term actions category – Workplace Violence in Health Care and Social Assistance, Cranes and Derricks in Construction, and Process Safety Management and Prevention of Major Chemical Accidents. The proposed rule stage saw an influx of new entries, most of which were published in the July 1 Federal Register.
The Standards Improvement Project, slated for proposal in May 2026, intends to “remove, modernize, or narrow duplicative, unnecessary, or overly burdensome regulatory provisions.”
OSHA renewed its alliance with the National Waste and Recycling Association and the Solid Waste Association of North America. The partnership will focus on safety issues such as transportation hazards; slips, trips, and falls; needlestick and musculoskeletal injuries; and health issues associated with lithium battery hazards in waste/recycling collection and processing.
For the 15th year in a row, fall protection for construction topped OSHA’s list of top 10 violations. In fiscal year 2024, there were 5,914 recorded fall protection violations, down from 7,271 in fiscal year 2023. The standards that round out the top 10 remain unchanged, with a shift in some of the rankings.
Turning to environmental news, EPA proposes to eliminate the Greenhouse Gas Reporting Program requirements for all source categories except the petroleum and natural gas systems category. The agency also proposes to suspend compliance obligations for covered facilities until 2034. A public hearing was held October 1 and stakeholders have until November 3 to comment on the proposal.
Hazardous waste handlers may continue to use 5-paper copy manifest forms. EPA announced it will accept these forms from entities regulated by the Resource Conservation and Recovery Act, or RCRA, until further notice. The agency will give a 90-day notice before it plans to stop accepting the 5-copy forms.
And finally, EPA published its Spring 2025 regulatory agenda on September 4. The agenda outlines the agency’s upcoming regulatory actions and their status in the rulemaking process. Major updates on the docket include those for greenhouse gases, risk management rules, and the Renewable Fuel Standards for 2026 and 2027.
Thanks for tuning in to the monthly news roundup. We’ll see you next month!

NewsHazardous WasteEnforcement and Audits - OSHAToxic Substances Control Act - EPAToxic Subtances Control Act - EPAElectronic Reporting of Injury and Illness RecordsTSCA ComplianceMonthly Roundup VideoCAA ComplianceUSAInjury and Illness RecordkeepingWaste/HazWasteEnglishOSHA Violations and PenaltiesIndustry NewsCrystalline SilicaWaste HandlersSafety & HealthGeneral Industry SafetyWasteWaste TransportersEnvironmentalFocus AreaToxic and Hazardous Substances - OSHAVideo
EHS Monthly Round Up - January 2025
In this January 2025 monthly roundup video, we'll review the most impactful environmental health and safety news.
Hi everyone! Welcome to the monthly news roundup video, where we’ll review the most impactful environmental health and safety news. There’s a lot going on, so let’s get started!
As happens at the start of most incoming presidential administrations, a freeze has been placed on all regulatory activity at the federal level, giving the new administration time to review agencies’ plans. The Office of Management and Budget, which must approve most rulemaking activities, has sent numerous pending rules back to the agencies for review. In addition, OSHA withdrew its infectious diseases proposed rule and its COVID-19 in healthcare rule prior to the inauguration.
OSHA’s penalties increased on January 15. The maximum penalty amounts for serious and other-than-serious violations increased to $16,550. For willful or repeated violations, the maximum penalty increased to $165,514 per violation.
OSHA updated its directive on injury and illness recordkeeping policies and procedures. While it’s intended for OSHA compliance officers, employers can use the information to help with recordkeeping compliance.
Fewer workers died on the job in 2023, as fatal work injuries decreased 3.7 percent from 2022. Transportation incidents remained the most frequent type of fatal event, accounting for over 36 percent of all occupational fatalities.
California’s Occupational Safety and Health Standards Board voted to adopt a permanent silica standard. If approved, it would extend and strengthen the state’s emergency temporary standard, which was put in place in December 2023.
The National Institute for Occupational Safety and Health updated its List of Hazardous Drugs in Healthcare Settings. This is a resource for employers and employees in identifying drugs that are hazardous to the health and safety of those who handle them.
Turning to environmental news, EPA released the biannual update of the nonconfidential TSCA inventory. The inventory helps facilities determine their regulatory requirements for the chemicals they use or plan to use.
And finally, EPA added new Management Method Codes to describe how hazardous waste will be managed after temporary storage and transfer. As of January 1st, hazardous waste handlers must use the codes on the Biennial Report Waste Generation and Management forms.
Thanks for tuning in to the monthly news roundup. We’ll see you next month!

NewsProcess Safety ManagementEnforcement and Audits - OSHAToxic Substances Control Act - EPAWasteErgonomicsMonthly Roundup VideoUSAWaste/HazWasteEnglishErgonomicsIndustry NewsEnforcement and Audits - OSHASafety & HealthToxic Substances - EPAGeneral Industry SafetyWasteEnvironmentalHazardous Materials Safety - OSHAFocus AreaVideo
EHS Monthly Round-Up - August 2024
In this August 2024 roundup, we'll review the most impactful environmental, health, and safety news.
Hi everyone! Welcome to the monthly news roundup video, where we’ll review the most impactful environmental, health, and safety news. Please view the content links in the transcript for more information about the topics I’ll be covering today. Let’s get started!
Two State Plan agencies allegedly provided advance notice of workplace inspections to employers, a practice that’s prohibited under the Occupational Safety and Health Act. Now, lawmakers have requested that the Department of Labor’s acting secretary address the allegations and explain what challenges OSHA faces when monitoring and enforcing State Plan compliance.
A recent study shows jobs in agriculture, forestry, fishing, and hunting are among California’s most dangerous, accounting for the highest number of fatalities among full-time workers. Transportation and utilities jobs ranked second and construction was third.
Remote isolation of process equipment can quickly stop the release of hazardous materials, which can help prevent fatalities and injuries, limit facility damage, and better protect communities and the environment. A U.S. Chemical Safety Board study explores their use and makes recommendations for their utilization in chemical facilities.
A National Safety Council report explores the role of diversity, equity, and inclusion on work-related musculoskeletal disorders, or MSDs. MSDs are the most common workplace injury and often lead to worker disability, early retirement, and employment limitations.
And finally, turning to environmental news, EPA published a final rule that revises its hazardous waste export manifest regulations. All hazardous waste shipments and manifest-related reports will be managed electronically through the agency’s e-Manifest program.
Thanks for tuning in to the monthly news roundup. We’ll see you next month!
Most Recent Highlights In Human Resources
NewsIndustry NewsEnglishIn-Depth ArticleCAA ComplianceSustainabilityEnvironmental Management SystemsCWA ComplianceEnvironmentalWaste/HazWasteSustainabilityESG (Environmental, Social, and Governance)Focus AreaUSA
2026-06-26T05:00:00Z
Multimedia inspections are back: How to prepare for comprehensive EPA and state audits
Regulators have returned to routine, in-person inspections, and many are no longer limited to a single program. The Environmental Protection Agency (EPA) and state agencies are again conducting multimedia inspections that review air, water, and hazardous waste compliance in one visit. For facilities, this shift raises the stakes. An issue in one program can quickly lead inspectors into others, especially when records or operations don't align.
Most inspectors now arrive with background data already reviewed. Electronic submissions, air reports, discharge monitoring reports, and hazardous waste filings are compared against what they see on-site. When numbers, dates, or practices don't match, the scope of the inspection often expands.
What inspectors are really evaluating
While documents are important, inspectors focus on whether procedures match actual operations. They will often start with a walk-through of the facility, tracing how materials move through production and become emissions, discharges, or wastes.
For example:
- Air compliance may be checked by reviewing fuel use, hours of operation, or control device logs;
- Stormwater compliance often involves visual checks for exposed materials and conditions of controls; and
- Hazardous waste inspections typically focus on labeling, container condition, and accumulation practices.
The common thread is consistency. If a plan says one thing but operators do another, it's likely to result in a finding.
Common gaps seen during multimedia inspections
Across industries, several issues appear repeatedly:
- Records that don't match across programs (e.g., waste logs versus manifests);
- Missing or incomplete inspection logs for air or stormwater systems;
- Assumptions about exemptions without supporting documentation;
- Satellite accumulation areas managed informally outside environmental oversight; and
- Housekeeping issues that create unintended stormwater exposure.
Many of these aren't complex violations. They're breakdowns in communication, training, or follow-through.
A practical way to prepare
Facilities can improve readiness by conducting an internal, cross-media review that mirrors an actual inspection. This is more effective than reviewing each program in isolation.
Start with a process-based walk-through:
- Identify where raw materials enter the facility.
- Follow how they're used, stored, and handled.
- Note where wastes, emissions, or discharges are generated.
- Confirm how each is managed and documented.
At each step, ask two questions:
- Is this activity reflected accurately in our records and plans?
- Would an operator explain it the same way it's written?
This approach often reveals gaps that aren't obvious during a desk review.
A recent case: How one issue expands the scope
At a mid-sized manufacturing facility, inspectors began with a routine hazardous waste review. They noticed that waste logs showed periodic disposal of solvent residues, but there were no related air records for emissions tied to cleaning operations.
This led inspectors to review the facility’s air permit assumptions. They found that solvent use had increased over time, but the facility hadn't updated its potential-to-emit calculations. What started as a simple waste review expanded into an air applicability concern.
The facility ultimately faced findings in both programs, not because of a single major violation, but because information didn't align across systems.
Strengthening compliance across programs
Preparation doesn't require building new systems. It requires making sure existing ones are aligned and consistently followed.
Focus on:
- Clear ownership of compliance tasks across departments;
- Regular cross-checks between records (air, water, waste);
- Training staff on how their daily tasks affect compliance; and
- Maintaining documentation that supports assumptions, exemptions, and limits.
Facilities that treat compliance as a connected system, not separate programs, are better positioned during inspections.
Key to remember: A multimedia inspection looks for consistency across air, water, and waste programs, not just isolated compliance. If your records and operations tell the same story, you're far less likely to face expanded scrutiny.
NewsHazardous WasteIndustry NewsWaste GeneratorsEnglishWasteEnvironmentalIn-Depth ArticleWaste/HazWasteFocus AreaUSA
2026-06-25T05:00:00Z
Hazardous waste episodic events: What to do when a bad month happens
Every generator has that month. A tank clean-out gets scheduled; a forklift punctures a tote, and suddenly you've generated way more hazardous waste than you normally would. If you're a Very Small Quantity Generator (VSQG) or Small Quantity Generator (SQG), that one bad month could technically bump you into Large Quantity Generator (LQG) status, potentially subjecting the facility to LQG requirements such as contingency planning, personnel training, and biennial reporting.
The good news is that EPA built in an escape hatch. The 2016 Generator Improvements Rule added 40 CFR Part 262, Subpart L (the "episodic event" provision), which lets you keep your normal generator category for that month, if you follow the rules in 40 CFR 262.232 exactly.
Scenario 1: The planned tank clean-out
Picture a metal finishing shop that's normally an SQG, generating about 400 kg/month of spent plating solution. They finally get around to cleaning out an old process tank that's been sitting idle for three years. That clean-out produces about 1,800 kg of sludge in one shot and enough to push them into LQG numbers for the month.
Since this is something the facility planned and scheduled for, it's a planned episodic event. Here's what the employer would need to do:
- Notify EPA (or the delegated state agency) at least 30 calendar days before the clean-out starts, using EPA Form 8700-12. Include the start/end dates, why the event is happening, estimated waste types and quantities, and a 24-hour emergency contact.
- Double-check the facility's EPA ID number to make sure it is current.
- Stage the waste properly with compliant containers or tanks and labeled with the episodic event start date.
- Get it manifested and shipped off-site within 60 calendar days of the start date.
- Hang onto every record including the notification, manifests for 3 years after the event ends.
Scenario 2: The unplanned spill
Next, picture a packaging plant. They are a VSQG generating around 80 kg/month. They have a forklift punch a hole in a 275-gallon tote of listed solvent and by the time cleanup is done, they're looking at about 900 kg of contaminated absorbent and solvent residue. Nobody planned this. It's not part of normal operations. That makes it an unplanned episodic event. Here is what they should do:
- They have 72 hours to notify EPA or the state by phone, email, or fax. There will be no time to fill out paperwork first.
- Follow that up by submitting EPA Form 8700-12 after the fact, documenting what happened since you couldn't give advance notice.
- Keep the spill cleanup waste separate from your routine waste streams and label it with the episodic start date.
- The same 60-day shipping window and 3-year recordkeeping requirement apply here too.
The things you can't skip
Whether the event is planned or unplanned, there are a handful of conditions that apply across the board and missing any one of them could cost you the episodic event relief entirely.
- One event per year, period. Both VSQGs and SQGs get exactly one episodic event a year unless they petition the Regional Administrator under 40 CFR 262.233 for a second. That second one must be the opposite type, so if your first was planned, the next must be unplanned.
- The clock doesn't wait. Exactly 30 days out for planned and 72 hours for unplanned are required. Miss either window or you lose the relief entirely, meaning full LQG status kicks in for that period.
- The 60-day shipping clock starts on day one of the event, not when you send the notification, so make sure to track it immediately.
- Manifest the waste properly. Episodic waste can ship under the standard Subpart B manifest rules, even in the same load as your regular waste.
- Write everything down. Three years of solid records such as dates, causes of event, quantities, and where it went is what separates a clean inspection from an enforcement headache.
Keys to remember: The episodic event provision rewards generators who plan, classify the event correctly, notify on time, ship within 60 days, and document everything for three years.
NewsGreenhouse GasesAir QualityAir EmissionsChange NoticesChange NoticeVirginiaCAA ComplianceEnvironmentalFocus AreaEnglishAir ProgramsAir Programs
2026-06-24T05:00:00Z
Virginia reinstates power plant CO2 budget program
Effective date: April 24, 2026
This applies to: Power plant owners
Description of change: The Virginia Department of Environmental Quality reinstated the Virginia CO2 Budget Trading Program Regulation, which implements the Regional Greenhouse Gas Initiative (RGGI). Participation in the RGGI was stopped in 2023, but the state will resume participation on July 1, 2026, the same date on which the compliance requirements take effect.
The regulation requires fossil fuel-fired units that serve an electricity generator with a capacity of 25 megawatts or more to obtain enough allowances to cover CO2 emissions, which they can purchase in the September and December RGGI auctions.
The department also adopted amendments to the regulations, including establishing a one-time 6-month control period from July 1, 2026, to December 31, 2026.
Related state info: Clean air operating permits state comparison
NewsMunicipal WastewaterChange NoticesChange NoticeWater ProgramsEnvironmentalCWA ComplianceEnglishFocus AreaNorth Carolina
2026-06-24T05:00:00Z
North Carolina approved revisions to wastewater discharge rules
Effective date: May 1, 2026
This applies to: Facilities with domestic wastewater discharges up to 2 million gallons per day
Description of change: The North Carolina Department of Environmental Quality (DEQ) adopted a rule that adds a permitting option to the National Pollutant Discharge Elimination System (NPDES) program for facilities with domestic wastewater discharges of up to 2 million gallons per day.
DEQ removed the ban on new or expanded discharges of oxygen-consuming waste when the 7Q10 and 30Q2 flows are both 0 for these facilities. In other words, it allows systems to discharge domestic wastewater to zero-flow receiving streams, provided the system:
- Meets qualifying criteria,
- Complies with specific effluent limits, and
- Uses low-energy methods before discharging wastewater to the receiving stream.
It’ll likely benefit areas where the cost of piping to a higher-flowing stream farther away is prohibitive.
NewsGroundwaterSafe Drinking WaterWater ProgramsWater QualityWater ProgramsCWA ComplianceEnglishWater PermittingMunicipal WastewaterChange NoticesChange NoticeWater ReportingIndustrial WastewaterEnvironmentalNew HampshireFocus Area
2026-06-24T05:00:00Z
New Hampshire updates sludge management rules
Effective date: May 15, 2026
This applies to: Owners and operators of drinking water and wastewater treatment plants that generate sludge; land application sites; and facilities that treat, manage, or dispose of sludge
Description of change: The New Hampshire Department of Environmental Services amended sludge management rules. Major changes include:
- Reinstating 5-year site and facility permit renewals (instead of 10 years),
- Adding annual reporting requirements for sludge haulers (which already apply to septage haulers), and
- Requiring all applications to be submitted electronically.
The rule also codifies per- and polyfluoroalkyl substances (PFAS) sampling (implemented in 2019 for the sludge quality certificate program).
New Network Poll

No active poll
Please come back soon!
Most Popular Highlights In Environmental
NewsGroundwaterToxic/Hazardous Substance ReleasesCERCLA, SARA, EPCRASafe Drinking WaterChange NoticesChange NoticeWater ProgramsNew JerseyEnvironmentalCWA ComplianceEnglishFocus Area
2026-06-24T05:00:00Z
New Jersey adopts permanent remediation standards for PFAS
Effective date: June 15, 2026
This applies to: Contaminated sites subject to the remediation regulations for contaminated groundwater, soil, and soil leachate
Description of change: The New Jersey Department of Environmental Protection (NJDEP) formally adopted its interim remediation standards for specific per- and polyfluoroalkyl substances (PFAS), including:
- Groundwater quality standards for hexafluoropropylene oxide dimer acid and its ammonium salt (GenX chemicals); and
- Soil and soil leachate remediation standards for:
- Perfluorononanoic acid (PFNA);
- Perfluorooctane sulfonate (PFOS);
- Perfluorooctanoic acid (PFOA);
- GenX chemicals; and
- Methanol.
The interim standards have been in place since 2022 and 2023, requiring regulated entities to conduct remediation to ensure these PFAS are cleaned up.
Additionally, the NJDEP amended the technical requirements to mandate analyses of the following chemicals in all media when contaminants are unknown or not well documented at a contaminated site:
- PFNA,
- PFOS,
- PFOA,
- GenX chemicals, and
- 2,3,7,8-tetrachlorodibenzo-p-dioxin.
NewsIndustry NewsIndustry NewsPesticidesPesticide Registration and LabelingEnvironmental Protection Agency (EPA)EnvironmentalEnglishFocus AreaPesticidesUSA
2026-07-01T05:00:00Z
EPA sets MyPeST compliance reporting deadlines for bilingual pesticide labeling requirements
The Environmental Protection Agency (EPA) published instructions and deadlines for pesticide registrants to report compliance with bilingual labeling requirements in the MyPeST application. The first compliance reporting deadline is July 31, 2026, for pesticide products with the highest toxicity.
Who’s impacted?
Compliance reporting applies to registrants of pesticide products subject to the bilingual labeling requirements established by the Pesticide Registration Improvement Act of 2022 (PRIA 5) amendments to the Federal Insecticide, Fungicide, and Rodenticide Act (FIFRA).
PRIA 5 requires all end-use pesticide product labels to provide Spanish translations of the human health and safety sections by including the translated sections directly on the label or providing a link via scannable technology or other readily accessible electronic methods to the translated sections. EPA allows certain antimicrobial and non-agricultural pesticide products to comply by providing access to Spanish-language Safety Data Sheets instead of direct label translations.
Compliance timelines are based on the type of pesticide and its toxicity category.
What’s required?
Pesticide registrants must report compliance with the PRIA 5 bilingual labeling requirements using EPA’s MyPeST app. The agency recently published detailed reporting instructions in the MyPeST Application User Guide (accessible in the MyPeST app).
EPA also established the following deadlines for reporting compliance in MyPeST:
| Pesticide product type | Bilingual labeling deadline | Compliance reporting deadline |
|---|---|---|
| Restricted use pesticides (RUPs) | December 29, 2025 | July 31, 2026 |
| Non-RUP agricultural products | ||
| Acute Toxicity Category I | December 29, 2025 | July 31, 2026 |
| Acute Toxicity Category II | December 29, 2027 | January 28, 2028 |
| Antimicrobials and non-agricultural products | ||
| Acute Toxicity Category I | December 29, 2026 | January 28, 2027 |
| Acute Toxicity Category II | December 29, 2028 | January 28, 2029 |
| All other pesticide products | December 29, 2030 | January 28, 2031 |
NewsGroundwaterSafe Drinking WaterWater ProgramsWater QualityWater ProgramsCWA ComplianceEnglishWater PermittingMunicipal WastewaterChange NoticesChange NoticeWater ReportingIndustrial WastewaterEnvironmentalNew HampshireFocus Area
2026-06-24T05:00:00Z
New Hampshire updates sludge management rules
Effective date: May 15, 2026
This applies to: Owners and operators of drinking water and wastewater treatment plants that generate sludge; land application sites; and facilities that treat, manage, or dispose of sludge
Description of change: The New Hampshire Department of Environmental Services amended sludge management rules. Major changes include:
- Reinstating 5-year site and facility permit renewals (instead of 10 years),
- Adding annual reporting requirements for sludge haulers (which already apply to septage haulers), and
- Requiring all applications to be submitted electronically.
The rule also codifies per- and polyfluoroalkyl substances (PFAS) sampling (implemented in 2019 for the sludge quality certificate program).
NewsMunicipal WastewaterChange NoticesChange NoticeWater ProgramsEnvironmentalCWA ComplianceEnglishFocus AreaNorth Carolina
2026-06-24T05:00:00Z
North Carolina approved revisions to wastewater discharge rules
Effective date: May 1, 2026
This applies to: Facilities with domestic wastewater discharges up to 2 million gallons per day
Description of change: The North Carolina Department of Environmental Quality (DEQ) adopted a rule that adds a permitting option to the National Pollutant Discharge Elimination System (NPDES) program for facilities with domestic wastewater discharges of up to 2 million gallons per day.
DEQ removed the ban on new or expanded discharges of oxygen-consuming waste when the 7Q10 and 30Q2 flows are both 0 for these facilities. In other words, it allows systems to discharge domestic wastewater to zero-flow receiving streams, provided the system:
- Meets qualifying criteria,
- Complies with specific effluent limits, and
- Uses low-energy methods before discharging wastewater to the receiving stream.
It’ll likely benefit areas where the cost of piping to a higher-flowing stream farther away is prohibitive.

NewsProcess Safety ManagementCERCLA, SARA, EPCRARisk Management ProgramRisk Management ProgramIn-Depth ArticleEnglishIndustry NewsEmergency Release PlanningSafety & HealthConstruction SafetyGeneral Industry SafetyEnvironmentalHazardous Materials Safety - OSHASARA ComplianceFocus AreaUSA
2024-12-03T06:00:00Z
Deadliest chemical disaster still haunts, decades later
December 2024 marks the 40th anniversary of one of history’s worst industrial incidents — the release of a deadly gas at a chemical plant in Bhopal, India. This incident, along with another in West Virginia in 1985, spurred U.S. legislative and regulatory action. However, some might say that work is not finished.
Think of the Emergency Planning and Community Right-to-Know Act (EPCRA) of 1986, the EPA Risk Management Program (RMP) standard, and the OSHA Process Safety Management (PSM) standard, for example. You’ll find roots to the Bhopal disaster.
What happened in Bhopal?
It was late on December 2, 1984, at a chemical facility. A faulty valve leaked water into a tank of methyl isocyanate (or MIC). This prompted in a violent reaction inside the tank. History tells us that about 1:00 a.m. on that fateful December 3, the failure of a safety valve triggered a massive release. A dense, lethal cloud of MIC and other chemicals drifted over the city of Bhopal.
By dawn, thousands of residents were dead, along with birds, dogs, cows, and other animals. The injured flocked to hospitals in overwhelming numbers. A lack of information about just what the chemicals were, however, compounded the catastrophe.
India officials reported half a million or more chemical exposures. Estimates vary, but as many as 10,000 people perished in the initial few days. Tens of thousands died prematurely in the decades to follow, according to sources.
What happened in West Virginia?
In August 1985, a chemical release in Institute, West Virginia, showed Americans that a “Bhopal-like” incident could happen here. Aldicarb oxime and other chemicals released from the facility, and over 125 residents landed in the hospital. Again, a lack of available chemical information was noteworthy. Many U.S. citizens began to fear they faced catastrophic risks.
What happened next?
In the wake of the incidents, Congress enacted laws:
- Superfund Amendments and Reauthorization Act (SARA) of 1986, including the Emergency Planning and Community Right-to-Know Act (EPCRA); and
- Clean Air Act Amendments of 1990.
Together they required EPA and OSHA to issue regulations to:
- Increase community chemical emergency preparedness,
- Require companies to report worst-case release scenarios,
- Require companies to develop RMPs and PSM programs to protect communities and workers, respectively.
Congress also established the Chemical Safety and Hazard Investigation Board (CSB) to investigate chemical incidents and recommend measures to prevent them. Despite these actions, the U.S. continues to experience serious chemical incidents. A visit to the CSB or National Response Center (NRC) websites reveals countless incident reports since 1990. A look at the 2024 data finds:
- 92 incidents reported to the CSB per 40 CFR 1604, and
- 21,125 reports made to the NRC per 40 CFR 302 and 355.
CSB video
Ten years ago, on the 30th anniversary of the Bhopal disaster, CSB posted a six-minute video explaining how the tragedy occurred. The video also examines more recent U.S. incidents. It emphasizes what more could be done to prevent similar incidents.
CSB investigations around the time of the video found deficiencies in design and PSM, similar to those uncovered in Bhopal! CSB Chairperson Rafael Moure-Eraso argued, “Process safety management regulations are in need of reform. There must be more emphasis on preventing the occurrence of major chemical accidents through safer design. Responding to emergencies and punishing people after the fact are not enough.”
Push for regulatory reform
Another headline-making incident in April 2013 involved a massive explosion of ammonium nitrate at a fertilizer storage/distribution facility in West, Texas. It fatally injured 12 volunteer firefighters and two members of the public and caused hundreds of injuries. The incident prompted Executive Order on Improving Chemical Facility Safety and Security (EO 13650) on August 1, 2013. The order directed the federal government to:
- Improve operational coordination with state and local partners;
- Enhance federal agency coordination and information sharing;
- Modernize policies, regulations, and standards; and
- Work with stakeholders to identify best practices.
The feds held listening sessions and issued a flurry of fact sheets, alerts, and enforcement policy changes. (See here and here.) Note that the RMP regulation at 40 CFR 68 was eventually amended this year, on March 11, 2024. The PSM standard remains unchanged, despite a request for information on December 9, 2013. In an about-face, Congress allowed the Chemical Facility Anti-Terrorism Standards program (at 6 CFR 27) to expire on July 28, 2023, but many in Congress and industry would like to see its return.
Key to remember
This month marks the 40th anniversary of the Bhopal chemical disaster. It sparked the U.S. Congress to take steps back then to prevent such a disaster from occurring here. Those actions did not spell the end to all chemical disasters in the U.S. In response, a renewed push for regulatory reforms popped up in the last decade.
NewsWasteTSCA ComplianceWater ProgramsEnvironmental Protection Agency (EPA)CAA ComplianceWater ProgramsCWA ComplianceWaste/HazWasteEnglishAir ProgramsIndustry NewsIndustry NewsWasteEnvironmentalFocus AreaSARA ComplianceAir ProgramsUSA
2026-07-09T05:00:00Z
EPA releases 2026 regulatory agenda
The Environmental Protection Agency (EPA) published the 2026 Agenda of Regulatory and Deregulatory Actions on July 3, 2026. The agenda outlines the agency’s upcoming regulatory actions and their status in the rulemaking process. Many of the proposed and final rules support EPA’s continued deregulatory efforts.
Significant rulemaking on EPA’s docket includes the following:
- Proposing risk management regulations under the Toxic Substances Control Act (TSCA) for various chemical substances, such as formaldehyde, diisodecyl phthalate (DIDP), and diisononyl phthalate (DINP);
- Aligning the definition of “waters of the United States” with the Supreme Court’s Sackett v. Environmental Protection Agency (2023) decision, which narrowed the definition under the Clean Water Act;
- Finalizing the part 2 risk management regulations for asbestos, including use and associated disposal requirements for legacy asbestos, asbestos-containing talc, and asbestos fibers other than chrysotile;
- Repealing the Carbon Pollution Standards (CPS) that limit greenhouse gas emissions from fossil fuel-fired plants (or repealing a narrower set of requirements under the CPS); and
- Establishing a federal permitting program under the Resource Conservation and Recovery Act (RCRA) for the disposal of coal combustion residuals (CCR).
Additionally, EPA continues to conduct rulemaking related to per- and polyfluoroalkyl substances (PFAS), such as:
- Revising existing effluent limitations guidelines and standards (ELGs) to address PFAS discharges from PFAS manufacturing facilities and chromium electroplating facilities;
- Extending the compliance deadlines for Maximum Contaminant Levels established by the National Primary Drinking Water Regulations (NPDWRs) for perfluorooctanoic acid (PFOA) and perfluorooctane sulfonic acid (PFOS); and
- Rescinding the NPDWRs for four PFAS.
This article highlights some of the major rules we’re monitoring closely. You can review the entire agenda to learn about all the rulemakings EPA plans to review, propose, and finalize. Please note that the agenda dates are tentative, indicating when the agency seeks to publish the rulemakings in the Federal Register.
| Final Rule Stage | |
| Projected publication date | Title |
| July 2026 | Reconsideration of the Greenhouse Gas Reporting Program |
| August 2026 | 1-Bromopropane (1-BP); Regulation Under the Toxic Substances Control Act (TSCA) |
| October 2026 | Revisions to Standards for the Open Burning/Open Detonation of Waste Explosives |
| October 2026 | Secondary Lead Smelting: National Emissions Standard for Hazardous Air Pollutants (NESHAP) Technology Review and Reconsideration |
| January 2027 | Listing of Specific PFAS as Hazardous Constituents |
| Proposed Rule Stage | |
| Projected publication date of notice of proposed rulemaking | |
| August 2026 | Improving Recycling and Management of Renewable Energy Wastes: Universal Waste Regulations for Solar Panels and Lithium Batteries |
| September 2026 | Effluent Limitations Guidelines and Standards for the Oil and Gas Extraction Category (40 CFR 435 Subpart E) |
| October 2026 | Effluent Limitations Guidelines and Standards for the Centralized Waste Treatment Category (40 CFR 437) |
| December 2026 | Clean Water Act Hazardous Substance Facility Response Plans; Amendment Reconsideration |
| December 2026 | National Emission Standards for Hazardous Air Pollutants: Stationary Combustion Turbines; Amendments |
| Pre-Rule Stage | |
| Projected publication date or other action | Title |
| January 2027 (final rule) | Risk Management Program, CAA Section 112(r)(7) (Section 610 Review) |
| August 2026 (begin review) | Oil and Natural Gas Sector: Emission Standards for New, Reconstructed, and Modified Sources (Section 610 Review) |
Most Popular Highlights In Transportation
NewsFleet SafetyFederal Motor Carrier Safety Administration (FMCSA), DOTChange NoticesChange NoticeBusiness planning - Motor CarrierFocus AreaFleet OperationsEnglishTransportationBusiness planning - Motor CarrierUSA
2026-07-21T05:00:00Z
FMCSA Final Rule: General Technical, Organizational, Conforming, and Correcting Amendments to the Federal Motor Carrier Safety Regulations
FMCSA amends its regulations by making technical corrections throughout the Federal Motor Carrier Safety Regulations (FMCSR). The Agency makes minor changes to correct inadvertent errors and omissions, remove or update obsolete references, and improve the clarity and consistency of certain regulatory provisions. FMCSA also makes a change to its rules of organization, procedures, and practice. Because the rule does not impose any new material requirements or increase compliance obligations, it is issued without prior notice and opportunity for comment, pursuant to the good cause exception in the Administrative Procedure Act (APA).
DATES: Effective July 21, 2026. Petitions for reconsideration of this final rule must be submitted to the FMCSA Administrator no later than August 20, 2026.
Published in the Federal Register July 21, 2026, page 45653.
View final rule.
| Appendix A to Part 372 – Commercial Zones | ||
| Sec. 44 | Revised | View Text |
| §384.234 Driver medical certification recordkeeping. | ||
| Revised | Revised | View Text |
| §384.301 Substantial compliance-general requirements. | ||
| Entire section | Revised | View Text |
| Appendix B to Part 386 – Penalty Schedule: Violations and Monetary Penalties | ||
| (g)(1) | Revised | View Text |
| §387.9 Financial responsibility, minimum levels. | ||
| Table 1, second entry | Revised | View Text |
| §387.307 Property broker surety bond or trust fund. | ||
| (e)(1)(iv)(C) | Revised | View Text |
| (e)(3)(ii) | Revised | View Text |
| §389.31 Petitions for rulemaking. | ||
| (b)(1) | Revised | View Text |
| §390.5 Definitions. | ||
| Gross vehicle weight rating (GVWR) definition | Revised | View Text |
| §390.5T Definitions. | ||
| Gross vehicle weight rating (GVWR) definition | Revised | View Text |
| §390.27 Locations of motor carrier safety service centers. | ||
| Midwestern service center entry | Revised | View Text |
| Western service center entry | Revised | View Text |
| §391.23 Investigation and inquiries. | ||
| (a)(1) | Revised | View Text |
| (m)(3)(i)(C) | Revised | View Text |
| §391.41 Physical qualifications for drivers. | ||
| (a)(1)(i) | Revised | View Text |
| §391.45 Persons who must be medically examined and certified. | ||
| (b) | Revised | View Text |
| §393.45 Brake tubing and hoses; hose assemblies and end fittings. | ||
| (b)(2) | Revised | View Text |
| §395.38 Incorporation by reference. | ||
| Section heading | Revised | View Text |
| §396.3 Inspection, repair, and maintenance. | ||
| (b)(1) | Revised | View Text |
| §399.205 Definitions. | ||
| Person definition | Revised | View Text |
Previous Text
Appendix A to Part 372 – Commercial Zones
* * * *
Sec. 44
Sec. 44 Commercial zones determined generally, with exceptions.
The commercial zone of each municipality in the United States, with the exceptions indicated in the note at the end of this section, within which the transportation of passengers or property, in interstate or foreign commerce, when not under a common control, management, or arrangement for a continuous carriage or shipment to or from a point without such zone, is exempt from all provisions of Part II, Interstate Commerce Act, except the provisions of section 204 relative to the qualifications and maximum hours of service of employees and safety of operation or standards of equipment shall be deemed to consist of:
(a) The municipality itself, hereinafter called the base municipality;
(b) All municipalities which are contiguous to the base municipality;
(c) All other municipalities and all unincorporated area within the United States which are adjacent to the base municipality as follows:
(1) When the base municipality has a population less than 2,500 all unincorporated areas within two miles of its corporate limits and all of any other municipality any part of which is within two miles of the corporate limits of the base municipality,
(2) When the base municipality has a population of 2,500 but less than 25,000, all unincorporated areas within 3 miles of its corporate limits and all of any other municipality any part of which is within 3 miles of the corporate limits of the base municipality,
(3) When the base municipality has a population of 25,000 but less than 100,000, all unincorporated areas within 4 miles of its corporate limits and all of any other municipality any part of which is within 4 miles of the corporate limits of the base municipality, and
(4) When the base municipality has a population of 100,000 or more, all unincorporated areas within 5 miles of its corporate limits and all of any other municipality any part of which is within 5 miles of the corporate limits of the base municipality, and
(d) All municipalities wholly surrounded, or so surrounded except for a water boundary, by the base municipality, by any municipality contiguous thereto, or by any municipality adjacent thereto which is included in the commercial zone of such base municipality under the provisions of paragraph (c) of this section.
Note: Except: Municipalities the commercial zones of which have been or are hereafter individually or specially determined.
§384.234 Driver medical certification recordkeeping.
The State must meet the medical certification recordkeeping requirements of §383.73(a)(2)(vii), (b)(5), (c)(8), (d)(8), (e)(6) and (o).
§384.301 Substantial compliance-general requirements.
(a) To be in substantial compliance with 49 U.S.C. 31311(a), a State must meet each and every standard of subpart B of this part by means of the demonstrable combined effect of its statutes, regulations, administrative procedures and practices, organizational structures, internal control mechanisms, resource assignments(facilities, equipment, and personnel), and enforcement practices.
(b)(1) A State must come into substantial compliance with the requirements of subpart B of this part in effect as of September 30, 2002 as soon as practical, but, unless otherwise specifically provided in this part, not later than September 30, 2005.
(2) Exception. A State must come into substantial compliance with 49 CFR 383.123 not later than September 30, 2006.
(c) A State must come into substantial compliance with the requirements of subpart B of this part in effect as of September 4, 2007 as soon as practical but, unless otherwise specifically provided in this part, not later than September 4, 2010.
(d) A State must come into substantial compliance with the requirements of subpart B of this part in effect as of January 30, 2009, as soon as practical, but not later than January 30, 2012.
(e) A State must come into substantial compliance with the requirements of subpart B of this part in effect as of October 27, 2010 as soon as practical, but not later than October 28, 2013.
(f) A State must come into substantial compliance with the requirements of subpart B of this part in effect as of July 8, 2011 and April 24, 2013 as soon as practical but, unless otherwise specifically provided in this part, not later than July 8, 2015.
(g) A State must come into substantial compliance with the requirements of subpsubpart Bart B of this part, which is effective as of December 5, 2011, as soon as practicable, but not later than January 30, 2012.
(h) A State must come into substantial compliance with the requirements of of this part in effect as of January 3, 2012) as soon as practical, but not later than January 3, 2015.
(i) A State must come into substantial compliance with the requirements of subpart B of this part and part 383 of this chapter in effect as of June 22, 2015, as soon as practical, but, unless otherwise specifically provided in this part, not later than June 23, 2025.
(j) A State must come into substantial compliance with the requirements of subpart B of this part and part 383 of this chapter in effect as of December 12, 2016 as soon as practicable, but, unless otherwise specifically provided in this part, not later than December 12, 2019.
(k) A State must come into substantial compliance with the requirements of subpart B of this part and part 383 of this chapter in effect as of February 6, 2017, but not later than February 7, 2022.
(l) A State must come into substantial compliance with the requirements of subpart B of this part and part 383 of this chapter in effect as of November 27, 2018 as soon as practicable, but, unless otherwise specifically provided in this part, not later than November 27, 2021.
(m) A State must come into substantial compliance with the requirements of part 383 of this chapter in effect as of September 23, 2019, or as soon as practicable, but not later than September 23, 2022.
(n) A State must come into substantial compliance with the requirements of this part in effect as of August 23, 2021, as soon as practicable, but not later than August 22, 2024.
(o) A State must come into substantial compliance with the requirements of subpart B of this part and part 383 of this chapter in effect as of November 8, 2021, as soon as practicable, but, unless otherwise specifically provided in this part, not later than November 18, 2024.
(p) A State must come into substantial compliance with the requirements of subpart B of this part, which is effective as of July 15, 2024, as soon as practicable, but not later than August 22, 2024.
(q) A State must come into substantial compliance with the requirements of subpart B of this part and part 383 of this chapter related to non-domiciled CLPs and CDLs, effective March 16, 2026, prior to issuing (which includes amending, correcting, reprinting, reinstating, or otherwise duplicating a previously issued CLP or CDL), transferring, renewing, or upgrading a non-domiciled CLP or CDL.
Appendix B to Part 386 – Penalty Schedule: Violations and Monetary Penalties
* * * *
(g)(1) A person who operates as a motor carrier for the transportation of property in violation of the registration requirements of 49 U.S.C. 13901 is liable for a minimum penalty of $13,676 per violation.
§387.9 Financial responsibility, minimum levels.
* * * *
* * * *
Table 1 to §387.9—Schedule of Limits—Public Liability
| (2)For-hire and Private (In interstate, foreign, or intrastate commerce, with a gross vehicle weight rating of 10,001 or more pounds). | Hazardous substances, as defined in 49 CFR 171.8, transported in bulk in cargo tanks, portable tanks, or hopper-type vehicles with capacities in bulk; in bulk Division 1.1, 1.2 or 1.3 materials; in bulk Division 2.3, Hazard Zone A material; in bulk Division 6.1, Packing Group I, Hazard Zone A material; in bulk Division 2.1 or 2.2 material; or highway route controlled quantities of a Class 7 material, as defined in 49 CFR 173.403 | 5,000,000 |
§387.307 Property broker surety bond or trust fund.
* * * *
(e)(1)(iv)(C) Either the broker fails to respond within the time period provided in paragraph (e)(1)(D)(ii) of this section, or provides a response and the surety company or financial institution nevertheless determines that the claim is legitimate and that the surety company or financial institution expects to make one or more payments on the claim from the bond or trust fund.
* * * *
(e)(3)(ii) A list of currently pending claims, amounts, and evidence that the surety company or financial institution complied with the notification requirements in paragraph (e)(1)(D) of this section.
§389.31 Petitions for rulemaking.
* * * *
(b)(1) Be submitted in writing by mail to the Administrator, Federal Motor Carrier Safety Administration, 1200 New Jersey Ave. SE, Washington, DC 20590-0001 or electronically at www.regulations.gov, using the general petitions for rulemaking docket listed on FMCSA's website at www.FMCSA.dot.gov.
§390.5 Definitions.
* * * *
Gross vehicle weight rating (GVWR) means the value specified by the manufacturer as the loaded weight of a single motor vehicle.
§390.5T Definitions.
* * * *
Gross vehicle weight rating (GVWR) means the value specified by the manufacturer as the loaded weight of a single motor vehicle.
§390.27 Locations of motor carrier safety service centers.
| * * * * | ||
| Midwestern | Illinois, Indiana, Iowa, Kansas, Michigan, Minnesota, Missouri, Nebraska, Ohio, Wisconsin | 600 Holiday Plaza Drive, Suite 240, Matteson, Illinois 60443. |
| * * * * | ||
| Western | Alaska, American Samoa, Arizona, California, Colorado, Guam, Hawaii, Idaho, Mariana Islands, Montana, Nevada, New Mexico, North Dakota, Oregon, South Dakota, Texas, Utah, Washington, Wyoming | 12600 West Colfax Avenue, Suite B-300, Lakewood, Colorado 80215. |
§391.23 Investigation and inquiries.
* * * *
(a)(1) An inquiry, within 30 days of the date the driver’s employment begins, to each State where the driver held or holds a motor vehicle operator’s license or permit during the preceding 3 years, to obtain that driver’s motor vehicle record covering that driver’s prior 3-year driving history.
(m)(3)(i)(C) Through June 22, 2025, if the driver provided the motor carrier with a copy of the current medical examiner’s certificate that was submitted to the State in accordance with §383.73(a)(2)(vii) of this chapter, the motor carrier may use a copy of that medical examiner’s certificate as proof of the driver’s medical certification for up to 15 days after the date it was issued.
§391.41 Physical qualifications for drivers.
* * * *
(a)(1)(i) A person subject to this part must not operate a commercial motor vehicle unless he or she is medically certified as physically qualified to do so, and, except as provided in paragraph (a)(2) of this section, when on-duty has on his or her person the original, or a copy, of a current medical examiner’s certificate that he or she is physically qualified to drive a commercial motor vehicle. NOTE: Effective December 29, 1991, and as amended on January 19, 2017, the FMCSA Administrator determined that the Licencia Federal de Conductor issued by the United Mexican States is recognized as proof of medical fitness to drive a CMV. The United States and Canada entered into a Reciprocity Agreement, effective March 30, 1999, recognizing that a Canadian commercial driver’s license is proof of medical fitness to drive a CMV. Therefore, Canadian and Mexican CMV drivers are not required to have in their possession a medical examiner’s certificate if the driver has been issued, and possesses, a valid commercial driver license issued by the United Mexican States, or a Canadian Province or Territory, and whose license and medical status, including any waiver or exemption, can be electronically verified. Drivers from any of the countries who have received a medical authorization that deviates from the mutually accepted compatible medical standards of the resident country are not qualified to drive a CMV in the other countries. For example, Canadian drivers who do not meet the medical fitness provisions of the Canadian National Safety Code for Motor Carriers but are issued a waiver by one of the Canadian Provinces or Territories, are not qualified to drive a CMV in the United States. In addition, U.S. drivers who received a medical variance from FMCSA are not qualified to drive a CMV in Canada.
§391.45 Persons who must be medically examined and certified.
* * * *
(b) Any driver who has not been medically examined and certified as qualified to operate a commercial motor vehicle during the preceding 24 months, unless the driver is required to be examined and certified in accordance with paragraph (c), (d), (e), (f), (g), or (h) of this section;
§393.45 Brake tubing and hoses; hose assemblies and end fittings.
* * * *
(b)(2) Be secured against chaffing, kinking, or other mechanical damage; and
§395.38 Incorporation by reference.
§396.3 Inspection, repair, and maintenance.
* * * *
(b)(1) An identification of the vehicle including company number, if so marked, make, serial number, year, and tire size. In addition, if the motor vehicle is not owned by the motor carrier, the record shall identify the name of the person furnishing the vehicle;
§399.205 Definitions.
* * * *
Person —Any individual within the 5th percentile female adult through the 95th percentile male adult of anthropometric measures as described by the 1962 Health Examination Survey, “Weight, Height and Selected Body Dimensions of Adults, United States 1960–1962” which is incorporated by reference. It is Public Health Service publication No. 1000-Series 11-No. 8 and is for sale from the U.S. Department of Commerce, National Technical Information Service, 5285 Port Royal Road, Spring-field, Virginia 22161. When ordering use NTIS Accession No. PB 267174. It is also available for inspection at the Office of the Federal Register Library, Room 8301, 1100 L Street, NW, Washington, D.C. 20408. This incorporation by reference was approved by the Director of the Federal Register on July 17, 1979. These materials are incorporated as they exist on the date of the approval and a notice of any change in these materials will be published in the Federal Register.

NewsIndustry NewsFleet SafetyDriver qualificationsTransportationDrivers qualification (DQ file)Driving RecordsDriver abstractsIn-Depth ArticleEnglishFocus AreaUSA
2026-07-23T05:00:00Z
Why driver self-certification deserves a closer look
Most carriers review motor vehicle records (MVRs) looking for the obvious red flags. They check traffic convictions, suspensions, endorsements, restrictions, and medical certification information. But there's another item on a commercial driver’s license (CDL) driver's MVR that can easily be overlooked: the driver's self-certification status.
That oversight can create significant compliance problems.
When CDL drivers apply for, renew, or update their CDL, they must self-certify the type of commercial driving they perform. Depending on their operation, a driver may be classified as:
- Non-excepted interstate,
- Excepted interstate,
- Non-excepted intrastate, or
- Excepted intrastate.
For most motor carriers, drivers should be operating under a non-excepted category because they’re subject to medical qualification requirements. Drivers can update their self-certification status directly with their state driver licensing agency, typically with little employer involvement. But that's where mistakes can occur.
In some cases, a driver may change their status to an excepted category without fully understanding the requirements. In other cases, they may have legitimately qualified for an excepted category while working for a previous employer but never updated their status after changing jobs. Either way, if a carrier isn't paying close attention to this information, the error can go unnoticed until it's discovered during an audit or a roadside inspection.
Why ‘excepted’ matters
An excepted category isn’t simply an option that a CDL driver can choose for convenience. To self-certify as “excepted interstate,” a driver must operate exclusively under one of the FMCSA's excepted activities, such as certain government operations, emergency response functions, or other specifically exempted activities.
Likewise, a driver claiming “excepted intrastate” status must meet the exemption requirements established by the state in which they’re licensed. These exemptions vary from state to state. Many CDL holders incorrectly assume that if they’re not currently driving CDL-required commercial motor vehicles , they can self-certify as ”excepted intrastate” and avoid maintaining a DOT medical certificate on their driving record. Many states specifically prohibit this practice. The key takeaway is that carriers should understand their state’s self-certification rules rather than assume a driver’s selection is correct.
Interstate vs. intrastate
A couple of words on an MVR can make a big difference. When hiring a new driver, carriers should pay close attention to whether the driver is self-certified as interstate or intrastate. It is common to hire drivers who previously worked for an employer that operated exclusively in intrastate commerce.
If a driver is self-certified as “Non-Excepted Intrastate” and then begins operating in interstate commerce, this will quickly come to light during a roadside inspection or compliance review. Carries should make sure the individual reviewing MVRs understands what these categories mean and verifies that a driver's self-certification status aligns with the operations the driver will actually perform.
Key to remember: Because drivers update their self-certification status directly with their licensing agency, carriers shouldn’t assume the information is always accurate or consistent with the driver's current job duties. Taking extra time to closely review and verify a driver's self-certification category will prevent compliance issues down the road.
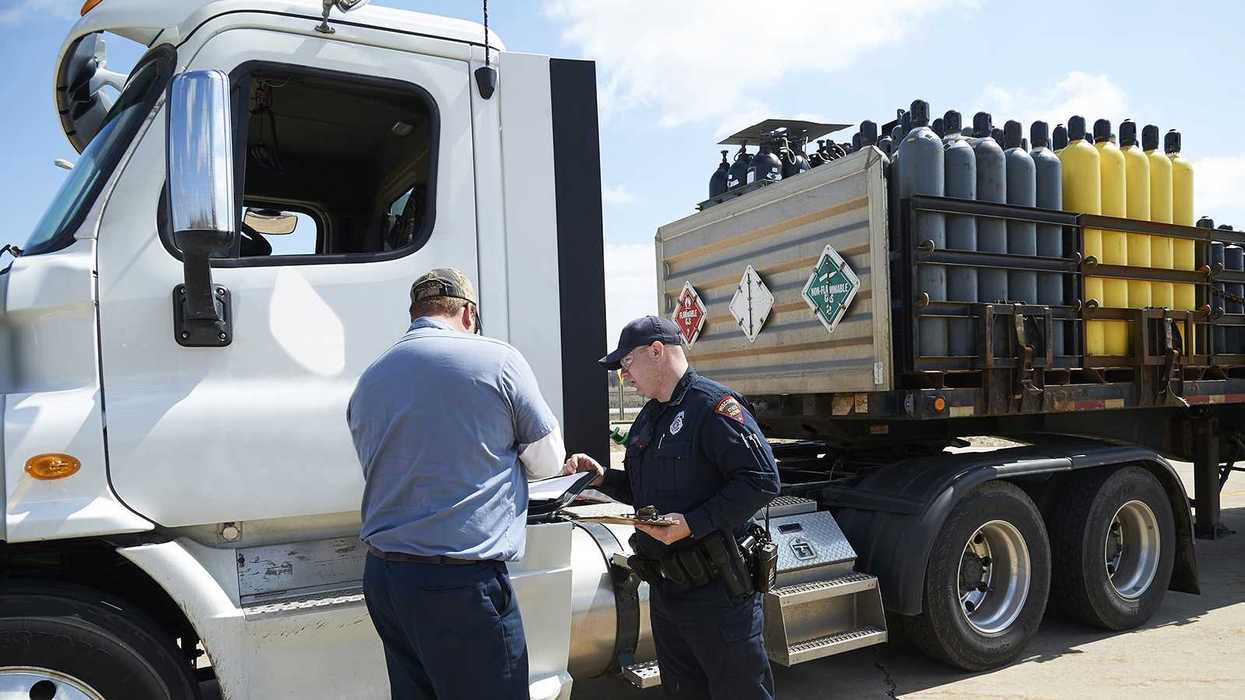
NewsIndustry NewsViolations - HazmatHazmat SafetyHazmat: HighwayFocus AreaIn-Depth ArticleEnglishTransportationUSA
2026-07-13T05:00:00Z
A midyear look at FMCSA's top hazmat violations
Roadside inspections are a fact of life for hazmat carriers. While inspectors encounter a wide range of compliance issues, Federal Motor Carrier Safety Administration (FMCSA) data shows that a handful of violations account for a significant share of hazmat citations year after year. Understanding these trends can help carriers focus their compliance efforts where they're likely to have the biggest impact.
Here's a look at the five most frequently cited hazmat roadside inspection violations so far in 2026 and what you can do to stay off the list.
1. Cargo not properly secured
The most common hazmat violation so far this year involves hazardous materials that weren’t properly blocked, braced, or secured during transportation. Inspectors recorded more than 1,000 of these violations.
To avoid this issue, verify that hazmat packages are adequately secured before departure and periodically check cargo during transit. Drivers should never assume a load was secured properly without conducting their own inspection.
2. Failure to produce a current hazmat registration
More than 400 violations were issued for failing to produce a current Pipeline and Hazardous Material Safety Administration (PHMSA) hazmat registration certificate or registration number during an inspection.
Usually, the company is registered but can’t provide proof of registration. Make sure registrations are renewed on time, current certificates are maintained, and employees know where the documentation is located.
3. No required shipping paper
FMCSA reported more than 360 violations involving vehicles operating without a required hazmat shipping paper.
Before a vehicle leaves the facility, confirm that the required shipping paper is present and complete. A simple shipping paper review as part of the pre-trip process can help prevent this violation.
4. Damaged or obscured placards
Nearly 350 violations involved placards that were damaged, faded, dirty, or otherwise difficult to read.
Include placards in routine vehicle inspections and replace them when necessary. Also ensure mud, snow, road grime, or other materials aren't obstructing their visibility.
5. Shipping paper accessibility
Rounding out the top five is shipping paper accessibility, with more than 340 violations reported so far this year.
Having a shipping paper isn't enough. It also has to be readily accessible. Drivers should be trained on accessibility requirements and consistently store shipping papers in the designated location. The best place for hazmat shipping papers in a vehicle is in a holder on the inside of the driver’s door.
A common theme
What's striking about the top violations so far this year is that most involve basic compliance fundamentals rather than complex regulatory requirements. Cargo securement, documentation, and placarding remain the areas where inspectors are finding the most problems.
Key to remember: Don't overlook the basics. Regular pre-trip inspections, refresher training, and periodic compliance reviews can go a long way toward preventing the violations that inspectors continue to find most often on the road.

NewsIndustry NewsFleet Safety150 air-mile radius exceptionHours of ServiceFocus AreaIn-Depth ArticleEnglishTransportationUSA
2022-08-29T05:00:00Z
The 150 air-mile short-haul exemptions: Widely used and widely misused
The 150 air-mile exemptions, which are in the regulations at 395.1(e)(1) and (2), allow a driver to use a time record in place of a log, provided that certain conditions are met. While this is possibly the most widely used hours-of-service exemption, it may be the most commonly misused exemption, as well.
The basics of logging exemptions
To be able to use this logging exemption in 395.1(e)(1), the driver must:
- Stay within 150 air-miles of the work reporting location for the day (draw a 150 air-mile radius circle around the work reporting location for the day — the driver must stay within this circle),
- Be back to — and released from — the work reporting location for his/her 8- or 10-hour break within 14 hours, and
- Include the starting and ending times for the day and the total hours on duty on the time record for the day.
The company must retain the time record and have it available for inspection for six months.
| Need more info? View our ezExplanation on the 150 air-mile exception. |
What if the driver goes too far or works too many hours?
If the driver cannot meet the terms of the exemption (he or she goes too far or works too many hours), the driver must complete a regular driver’s log for the day as soon as the exemption no longer applies.
If the driver has had to complete a log 8 or fewer days out of the last 30 days, the driver can use a paper log for the day. If the driver had to complete a log more than 8 days out of the last 30 days, the driver needs to use an electronic log for the day (unless one of the ELD exemptions applies, such as operating a vehicle older than model year 2000).
30-minute break exemption
When a property-carrying driver is operating under the 150 air-mile exemption, the driver is also exempt from having to take the required 30-minute break (see 395.3(a)(3)(ii)).
If the driver began the day as a 150 air-mile driver and has driven more than 8 consecutive hours without a break, and something unexpected happens and the driver can no longer use the 150 air-mile exemption, the driver must stop and immediately take the 30-minute break as well as start logging. If the driver went outside of the 150 air-mile area before the driver had 8 hours of driving without a break from driving, the driver would be expected to take the break at the appropriate time.
Common myths
Here are some of the common myths and misunderstandings about the 150 air-mile exemption:
- The driver must have the time records in the vehicle. Myth. The driver simply needs to explain to an officer during a roadside inspection that he/she does not have logs due to operating under the 150 air-mile exemption and that the required time records are back at the carrier’s office (just telling the officer, “I don’t have any logs” will lead to a violation, so the driver needs to know to provide the full explanation).
- The driver must log the previous seven days if he/she had been using this exemption and suddenly can’t. Myth. If the driver cannot use the exemption on one particular day, that is the only day the driver must use a regular log (either paper or electronic).
- Passenger-carrying drivers and drivers hauling hazardous materials cannot use this exemption. Myth. There are no restrictions on the use of this exemption, so any commercial driver can use it.
- A driver that crosses state lines cannot use this exemption. Myth. As this exemption appears in the Federal Motor Carrier Administration (FMCSA) regulations, it can be used by interstate drivers.
- Only drivers that operate out of a “company terminal” can use the 150 air-mile exemption. Myth. As long as the driver makes it back to the work reporting location for the day within the appropriate number of hours, the driver can use the exemption.
- Drivers that move from one jobsite to another every few weeks cannot use this exemption. Myth. If a driver that normally uses this exemption switches work reporting locations, the day the driver switches work reporting locations is the only day the driver cannot use the exemption.
- Drivers covered by this exemption are also exempt from the driver qualification (licensing and medical cards), driving, and vehicle inspection requirements. Myth. The only rules the driver is exempt from are the logging requirement in 395.8 and the 30-minute break requirement in 395.3.
- The driver cannot drive more than 150 miles for the day. Myth. The driver can drive as many miles as he/she wants to or needs to, as long as the driver stays within the 150 air-mile radius circle and gets back to the work reporting location within the appropriate number of hours.
- If a 150 air-mile driver gets into a vehicle with an ELD, the driver must use it. Myth. The carrier can have the driver log in and have the driver entered into the system as an “exempt driver,” or the carrier can request that the driver not log into the device and then attach a comment to the unassigned driving time generated by the driver’s movements. The comment would need to explain that the driver using the vehicle was a 150 air-mile driver who submitted a time record. It is up to the carrier to decide which option to use. If stopped for a roadside inspection, the driver will need to be able to explain to the inspector that he/she is an exempt driver using the 150 air-mile exemption, so using the electronic log is not required.
What’s different with the ‘150 air-mile non-CDL property-carrying drivers’
The 150 air-mile exemption at 395.1(e)(2) only applies to drivers that: Operate property-carrying vehicles that do not require a CDL to operate, and Stay within the 150 air-miles of their work reporting location.
If the driver stays within the 150 air-mile radius of the work reporting location, and returns to the work reporting location within 14 hours on 5 of the last 7 days, and 16 hours on 2 of the last seven days, the driver is allowed to use a time record in place of a log.
If the driver does not meet the terms of the exception, the driver will need to complete a log for the day. If the driver had to log more than 8 days out of the last 30 days, the driver will need to use an electronic log for the day. All of the other issues discussed above would apply to these drivers as well.
Managing the use
If you have drivers that use these exemptions, you will need to check time records to make sure they are complying with the appropriate time limits. You will also need to check movement records to verify that the drivers using these exemptions are staying within the mandated area (within 150 air-miles of the work reporting location for the day).
If a driver is over the hours limit, or has gone too far, you need to verify that the submitted a log for the day, either paper or electronic, depending on how many days the driver had to log out of the previous 30 days.
Verifying compliance is important
During an audit, if it is discovered that your drivers are using these exemptions incorrectly, you will be cited for not having drivers’ logs when required. Each day this occurred will be another violation, so the fine could be rather large if you are not managing the use of these exemptions!
NewsIndustry NewsFleet SafetyCMV Parts and MaintenanceCMV lights, reflectors, and reflective tapeFocus AreaIn-Depth ArticleEnglishTransportationUSA
2022-06-01T05:00:00Z
Check on compliance: Bobtail reflective tape
It’s not unusual for drivers to be cited for having the wrong (or no) reflective tape on the back of a Class 8 tractor. Violations that are “hidden” when a trailer is attached become obvious when bobtailing.
Are your trucks in compliance?
Enforcement officers often cite 393.11 for reflective taping violations on a bobtailing tractor, but the actual requirements are found in another, cross-referenced rule, 571.108.
You might recognize Part 571 as among the rules that vehicle manufacturers have to follow, but don’t be fooled: motor carriers must generally maintain their vehicles to those same standards.
Within 571.108, the tractor marking requirements can be found in paragraph S8.2.4, Conspicuity system installation on truck tractors.
Two sets of tape
The rules require two sets of reflective materials on the back of a tractor. One set is the white tape (or reflectors) that marks the upper corners, and the other is the red/white tape (or reflectors) often placed on or near the mudflaps.
Upper corners — The white tape marking the upper corners of the cab must consist of two 12-inch strips per corner, one placed vertically and one horizontally, as close to the upper corners as possible. Make sure they remain visible from the rear; no more than 25 percent may be obscured by equipment.
Mudflap — Here you’ll need one 24-inch strip of alternating red and white reflective tape per side, placed as horizontally as possible, to mark the vehicle’s width as seen from the rear.
- Find a location as close as possible to the side edges of the rear. This could be on the fenders, the mudflaps, the mudflap support brackets, or on plates attached to those support brackets.
- If you do put tape on the mudflaps, put it near the top (no farther than about 12 inches from the top edge).
- If the tractor has temporary mudflap support brackets, avoid them by placing the strips directly on the mudflaps or on plates that you can transfer to permanent mudflap support brackets.
- If the tractor has no mudflaps, you can mount the strips “outboard” of the frame, on brackets behind or ahead of the rear axle and above the top of the rear tires.
- If no other options are available, you can mount them to the back of the cab. However: (a) They must be as close as possible to the outer edges, above the top of the tires, and no more than 60 inches above the road surface when the vehicle is empty; and (b) when viewing the tractor from the rear, you must be able to see at least 75 percent of their combined area (that is, no more than 25 percent can be obscured by equipment).
Compliance tip: Reflective tape is designed to prevent crashes, but it does no good if no one can see it. Dirt, grime, and wear can significantly reduce its effectiveness, and is a violation of 392.33, Obscured lamps or reflective devices/material. Keep all reflective tape clean and replace it when necessary so it continues to meet the standards outlined here.
What about straight trucks?
The reflectivity requirements do not apply to straight trucks. Reflective tape or reflectors may be added as a safety enhancement, however, as long as it does not interfere with any required lights or equipment.

NewsIndustry NewsOn-duty time - Motor CarrierFleet SafetyHours of ServiceRisk Management TransportationRisk Management - Motor CarrierFocus AreaIn-Depth ArticleFleet OperationsEnglishTransportationUSA
2022-12-15T06:00:00Z
6 Yard Move FAQs – Need-to-know answers for carriers and drivers
A “yard move” (YM) is an electronic logging device (ELD) special driving category, which carriers have the option to authorize. Putting an ELD in the YM status can give a yard or road driver added flexibility or another avenue for falsification.
To avoid violations and increased risk, ensure that your drivers, dispatchers, and safety personnel know the answers to these frequently asked questions (FAQs).
1. What falls under the definition of a “yard”?
The Federal Motor Carrier Safety Administration (FMCSA) does not officially define a yard. Still, it is generally accepted an area that is not open to public travel due to being restricted by signs or gates.
A carrier’s terminal, a customer’s facility, or a rail yard can be a yard if the area cannot be defined as a highway per 390.5. A driver may also cross a public road to reach another part of private property under yard-move time if traffic controls (i.e., flagger) for the public are in place.
Malls, truck stops, and parking lots the public can access, however, are all examples of places that cannot be a yard for ELD and on-duty (not driving) purposes.
2. Is a yard driver subject to federal regulations?
Commercial motor vehicles (CMVs) are federally regulated at 10,001 pounds or greater — rated or actual, alone or in combination with a trailer. State definitions of a CMV vary.
Suppose a yard truck met the definition of a CMV and operates in an area open to public travel in interstate commerce. In that case, the yard driver must be qualified under Part 391 and is subject to all other applicable federal regulations. If the yard truck and trailer meet the definition of a CDL vehicle in 383.5 as most do, the driver is also subject to drug and alcohol testing and CDL requirements.
Yard drivers might not be required by their carrier to use an ELD to create a log. They are stillsubject to the hours-of-service limits in 395.3 and the same rules for on-duty (not driving) time in a yard or on-duty driving (Line-3) on a public roadway.
A carrier may allow the use of a time record instead of an ELD to track a yard driver’s time under the 150 air-mile exception in 395.1(e). If the yard driver uses an ELD, the carrier can designate the driver as “Exempt” (exempt from grid logs only) in the ELD back-office system.
3. How is a yard move recorded on an ELD?
YM time is visible in the ELD grid as driving time with a dashed or dotted line. Before using YM time, the driver must select the “YM” special driving category and annotate the ELD record describing the reason for the activity.
According to federal hours-of-service rules, a driver cannot use “Line-3” or on-duty driving time after 14 consecutive hours from the start of on-duty time for the day. However, yard moves are recorded as “Line-4 time” or on-duty not (driving) time. Therefore, YM time doesn’t stop the 14-hour clock, but can be appropriately used beyond the 14-hour or other driving limits.
4. Does a yard move count toward the 30-minute break from eight total hours of on-duty driving?
Yes. Because a YM is on-duty (not driving), it counts toward the 30-consecutive minute break from on-duty driving required after eight total hours of on-duty driving. (see 395.3(a)(3))However, if a driver is involved in a fatigue-related crash, driving in a yard to satisfy a break from driving requirement will not look prudent to a jury.
5. What if a driver forgets to change the driving status, and the ELD remains in YM-status after they leave the yard?
The time will be incorrectly captured as Yard Move (on-duty yard time rather than on-duty driving time) and could be considered a false log. To address this, the driver should attach a comment to the log explaining the error as soon as safely possible.
The driver’s log must be manually edited to the correct driving time if the ELD system allows the off-yard time to be changed to on-duty driving time. Otherwise, an annotation must be made noting the correct on-duty (not driving) and on-duty driving time.
6. How are yard moves audited?
Verify the location at the time of the YM with the location description or the longitude and latitude data from the ELD or vehicle tracking device. If the driver was not in a yard at the time of the YM, the driver falsified the record.
A driver using a public road in YM status to get fuel or take the truck in for maintenance is considered falsification. If the driver was over the 11-hour driving limit, 14-consecutive on-duty period, or the 60- or 70-hour limit, they now have an out-of-service violation and a false log.
Carriers can define a geo-fence or virtual boundary of the yard if the system allows that feature to indicate a departure from the yard.
Keys to remember:
Carriers must train their team to understand when the Yard Move status or on-duty (not driving) can and can’t be used when operating a CMV. Audit yard moves to ensure this ELD special driving category, or duty status for drivers on time records, is not used to falsify logs.
Most Popular Highlights In Human Resources

NewsIndustry NewsIndustry NewsHR GeneralistFamily and Medical Leave Act (FMLA)Family and Medical Leave Act (FMLA)USAHR ManagementEnglishFocus AreaHuman Resources
2023-09-06T05:00:00Z
Appellate court sided with employee's (almost) 3-year-delayed FMLA claim
Back in October 2018, Laffon had a medical emergency and needed some time off under the federal Family and Medical Leave Act (FMLA).
Her leave lasted until November 15. Ten days after she returned to work, on November 26, her employer terminated her.
She sued, arguing that the employer retaliated against her because of her FMLA leave.
The catch? She didn't bring the suit until almost three years later.
No link between leave and termination
In court, the employer argued that there was no causal link between Laffon taking FMLA leave and her termination. Although the court documents aren't robust, they do reveal that the employer indicated that Laffon's allegations didn't show that her taking FMLA leave was a factor in the decision to terminate her. The documents showed only that the termination chronologically followed her leave.
The court agreed with the employer. It also agreed that Laffon failed to allege a willful violation of the FMLA, which would allow her to benefit from the FMLA's three-year statute of limitations.
Laffon appealed the case to the Ninth Circuit.
Statute of limitations
Under the FMLA, employees have two years from the date of the last event constituting the alleged violation for which they can bring a claim.
Those two years are extended to three years if the employer's actions were "willful." This means that an employee must show that the employer either knew or showed reckless disregard for whether its conduct violated the FMLA.
Ruling overturned
Fast forward to August 2023, when the Ninth Circuit reversed the lower court's decision. It indicated that, based on Laffon's amended complaint and liberally construing the law, her allegations establish that her leave was causally connected to her termination and that the employer's action (her termination) was willful.
Glymph v. CT Corporation Systems, No. 22-35735, Ninth Circuit Court of Appeals, August 22, 2023.
Key to remember: Terminating an employee soon after returning from FMLA leave is risky, unless there is a clear, well-documented, non-leave-related reason. Case documents did not show such a clear reason, which can also increase the risk of a willful finding. Employees have time to file claims, even years.

NewsIndustry NewsHR GeneralistFamily and Medical Leave Act (FMLA)In-Depth ArticleFamily and Medical Leave Act (FMLA)HR ManagementEnglishUSAFocus AreaHuman Resources
2026-07-14T05:00:00Z
5 lesser-known FMLA requirements
Many employers have a process they follow when employees ask for leave under the federal Family and Medical Leave Act (FMLA). While each FMLA case can have its own quirks, employers might not be familiar with some of the law’s unique provisions.
What employers should know about the FMLA but might not
Here are five little-known FMLA requirements:
1. Poster: The FMLA poster has to be seen by applicants. Once employers are covered by the law, they must put the poster up where not only employees can see it, but applicants as well. This is true even if employers have no eligible employees.
If employers post job openings online and interview candidates electronically, they should place a prominent notice on the website where the job postings are listed stating that “Applicants have rights under federal employment laws” and link to the FMLA, EEO (Equal Employment Opportunity), and EPPA (Employee Polygraph Protection Act) posters.
825.300(a)(1)
2. Eligibility: The 1,250 hours worked that employees must meet to be eligible to take FMLA leave don’t include time not worked, like vacation, paid time off, and so forth. Employees must actually have worked the 1,250 hours, not just been paid for them. Therefore, when looking at whether an employee meets the 1,250 hours worked eligibility criteria, employers shouldn’t include hours that aren’t actually worked.
825.110.(c)(1)
3. Temp workers: Employers must include the time a temporary (“temp”) employee spent working for them toward their FMLA eligibility. As long as temp employees have worked for the company for at least 12 months and have performed at least 1,250 hours of work, they’re entitled to FMLA leave. If employers have temp employees that they then hire as regular employees, they must count all the time spent working as a temp employee toward their eligibility.
825.106 (OL FMLA-37)
4. Transferring: Employers may not transfer an employee to an alternative job during unforeseeable intermittent leave. The only time employers may transfer an employee to an alternate job is when the need for leave is foreseeable based on planned medical treatment. If employers allow employees to take bonding leave intermittently, they may also transfer employees.
825.204
5. Workers’ compensation: Employees on workers’ compensation (WC) can refuse light duty and remain on FMLA leave. They would lose their WC benefits. Employers may offer a "light duty" job to the employee to encourage them to return to work early, but if the employee is taking FMLA leave simultaneously, the employee isn’t required to end FMLA leave and accept the light-duty assignment. Employees who continue on FMLA leave may lose WC benefits, but may not be subjected to any form of disciplinary action for having exercised their FMLA rights.
825.207(e) (OL FMLA-38)
Key to remember: Employers won’t frequently run into the lesser-known FMLA provisions, but they must know what to do when they are in play.
NewsFamily and Medical Leave Act (FMLA)LeaveTime offFamily and Medical Leave Act (FMLA)HR ManagementEnglishLeaveLouisianaAssociate Benefits & CompensationChange NoticesChange NoticeHR GeneralistAssociate RelationsFocus AreaHuman Resources
2026-07-27T05:00:00Z
Louisiana adds living donor leave
Effective date: August 1, 2026
This applies to: State agencies and private employers with one or more employees,
Description of change: Effective August 1, 2026, Louisiana state employees may take paid, job-protected leave to donate organs. Employees of private employers in the state may take unpaid, job-protected leave to be donors.
To be eligible to take the paid leave, a full-time employee of a state agency must have been continuously employed by the same agency for at least 12 months.
The law doesn’t have eligibility criteria specifically for employees of private employers, but employees must request the leave in writing.
Employees may take up to 30 consecutive calendar days of leave to serve as human organ or bone marrow donors.
Employers are prohibited from retaliating against employees who request or take such leave.
The donor leave can run concurrently with leave under the federal Family and Medical Leave Act (FMLA).
View related state info: FMLA - Louisiana

NewsIndependent ContractorsContingent WorkforceFamily and Medical Leave Act (FMLA)Family and Medical Leave Act (FMLA)USAHR ManagementEnglishAssociate Benefits & CompensationIndustry NewsIndustry NewsWage and HourContingent WorkforceWage and HourHR GeneralistFair Labor Standards Act (FLSA)OvertimeAssociate RelationsFocus AreaHuman Resources
2026-07-06T05:00:00Z
Wage and Hour Division publishes its 2026 regulatory agenda
On July 6, the U.S. Department of Labor’s (DOL) Wage and Hour Division (WHD) published its 2026 unified regulatory agenda. The agenda offers a glimpse into what the WHD is planning for its regulations and when.
Joint employer proposed rule: July 2026
Since 2021, the WHD has had no regulatory guidance addressing joint employer liability under the Fair Labor Standards Act (FLSA). The WHD is considering a proposed rule to adopt regulations that would guide WHD enforcement of joint employer liability under the FLSA, the Family and Medical Leave Act (FMLA), and the Migrant and Seasonal Agricultural Workers Protection Act (MSPA). The WHD says that joint employer status under the FMLA and MSPA should be determined using the FLSA analysis.
When a rule is earmarked in the regulatory agenda as a “proposed rule,” that means the public expects to see written documentation on which they can provide their comments. The agencies involved then review the comments, and the rule moves to the next step in the legislative process. The dates listed are estimates that the agencies think they’ll have something posted for review.
Independent contractor final rule: October 2026
In 2024, the WHD published a final rule providing an analysis for determining employee or independent contractor (IC) classification under the FLSA. The 2024 IC rule took effect on March 11, 2024. The 2024 IC rule, however, is the subject of legal challenges. The WHD intends to rescind the 2024 IC rule. The WHD has also proposed to modify regulations interpreting the FMLA and MSPA to clarify that the analysis for determining employee or IC status under the FLSA also applies under the FMLA and MSPA.
The WHD considered three alternatives to the proposed rule, listed below from least to most restrictive:
- Adopting the common law control test, which applies in distinguishing between employees and ICs under various other federal laws;
- Adopting the WHD’s current enforcement policy, which is comprised of sub-regulatory guidance from before 2021 applying a multifactor economic reality balancing test; and
- Adopting a 3-pronged “ABC” test (which several states have adopted).
The WHD issued a proposed rule in February 2026, and the comment period ended on April 28.
A final rule addresses the public comments submitted in response to a proposed rule to help determine the final regulatory language. When an agency publishes a final rule, generally the rule is effective no less than 30 days after the date of publication in the Federal Register. A final rule doesn’t take effect until its “effective date” is reached.
Key to remember: The Wage and Hour Division is looking to revise the joint employer and independent contractor regulations.

NewsFamily and Medical Leave Act (FMLA)Family and Medical Leave Act (FMLA)In-Depth ArticleHR ManagementEnglishUSAIndustry NewsWage and HourWage and HourHours WorkedHR GeneralistFair Labor Standards Act (FLSA)Non-Exempt employees Associate RelationsFocus AreaHuman Resources
2025-01-16T06:00:00Z
Denying employees work access while on leave
Eligible employees may take up to 12 weeks of leave under the federal Family and Medical Leave Act (FMLA). Employers may not require employees to work during FMLA leave. If an employee does any work, employers may not count that time as FMLA leave.
Particularly for extended periods of leave, employers might want to ensure employees don’t do any work by cutting off access to it. Otherwise, employers must track the time employees spend working and the time they spend on leave.
Tracking leave
For hourly (nonexempt) employees, employers must pay employees for any hours worked and keep track of that time. If employees work remotely, they might be required to track and report their work hours.
For salaried (exempt) employees, employers don’t have to track their work hours, but must still keep accurate records of the time spent on FMLA leave.
Blocking access
To avoid non-compliance risks with tracking leaves, employers might choose to cut employees’ work access while on extended leave. This can include not only access to the physical workplace but also access to the virtual workplace, including emails and messages. Someone from IT might need to be involved.
If employers don’t want all communications shut down, they could work with employees to identify other means of communication, such as a personal email or phone number. That way, employees can continue to share information such as their intended return date. Employers should also ensure that important messages get through.
If access is not cut off, employers need to make sure that employees know that they should not work during leave and that there could be consequences for doing so.
Policies help
To help ensure consistency, employers should have well-communicated policies on not working during leave and what employees can expect. A well-written and communicated policy can:
- Help employees feel like they are not being punished by being banned from work,
- Show that employers take FMLA leave seriously, and
- Prohibit supervisors from asking employees to work while on leave.
If an employee violates the policy and does any work during leave, employers can look at it as a policy violation and apply their applicable discipline.
Key to remember: Employers may cut off access to work during leave, but doing so requires some careful forethought.

NewsIndustry NewsIn-Depth ArticleFamily and Medical Leave Act (FMLA)Family and Medical Leave Act (FMLA)USAHR ManagementEnglishFocus AreaHuman Resources
2023-07-20T05:00:00Z
Dealing with FMLA Monday/Friday absences
The federal Family and Medical Leave Act (FMLA) allows eligible employees to take job-protected leave for certain qualifying reasons. Over the years, employees have gotten creative when scheduling such leave, including taking it on Mondays and/or Fridays to extend a weekend.
Employers trying to oversee schedules and meet other business needs might get frustrated when employees take leave. When employees take leave in suspicious patterns, the frustration swells.
It doesn’t help that the FMLA restricts when and how employers may obtain information on the reasons behind leave.
Employers, however, do have some resources available to them when determining whether a Monday/Friday absence pattern is valid, or if the employee is abusing leave.
Recertifying FMLA leave
Once employers have a certification supporting the need for a leave, they may not request recertification more often than every 30 days, or until the minimum duration of the condition listed on the certification has expired.
Employers may, however, request recertification more often if:
- The employee requests an extension of leave,
- Circumstances described by the initial certification have changed significantly, or
- They receive information that casts doubt upon the reason for leave or the continuing validity of the certification.
When employers suspect FMLA abuse, they should review the information contained in the certification to see if the absences match. If not, they may investigate the situation further.
Asking about absence patterns
To help with this investigation, when requesting a recertification, employers may include a record of the employee’s absences and ask the health care provider if the pattern is consistent with the serious health condition.
It’s true that employers may not generally contact the employee’s health care provider directly for this information, but they may add this type of question to the medical recertification form, and direct the employee to have it completed.
Tracking absences
In such situations, employers might want to review the absence patterns of employees in question and be on the lookout for suspicious absences in the future.
Effectively tracking all leave is a must to identify patterns that could indicate FMLA leave abuse. If employers learn that an absence is not for a valid FMLA-qualifying reason, the employee is not entitled to the protections of the law for such an absence.
Key to remember: If employees are suspiciously taking FMLA leave such as on Mondays and Fridays, employers may request a recertification supporting the leave pattern.
Most Popular Highlights In Safety & Health

NewsIndustry NewsAccident Investigation - OSHAAccident Investigation - OSHASafety & HealthConstruction SafetyGeneral Industry SafetyIn-Depth ArticleEnglishFocus AreaUSA
2026-07-21T05:00:00Z
Not your worker, but still your problem
A single sulfuric acid spill at a Texas industrial facility triggered more than $3.5 million in proposed OSHA penalties, proving that finger-pointing is not a defense against OSHA citations. On December 27, 2025, the chemical storage facility in Texas suffered a catastrophic release when workers mixed fresh and spent sulfuric acid. This caused a tank over-pressure that ruptured a supply line and released roughly one million gallons of sulfuric acid, injuring multiple employees in the process. That event alone would have been serious enough, but there was more to the story that unfolded during the cleanup. It’s a story every employer who works alongside contractors, subcontractors, or even staffing agencies needs to understand.
Subcontracting the work doesn't subcontract the liability
After the spill, the host facility that owned the ruptured tank brought in an environmental remediation company to handle the hazardous cleanup. The remediation contractor, in turn, hired a subcontracted staffing firm to supply laborers for the physical remediation work. It’s an entirely ordinary practice to have a host site, general contractor, and subcontractors. It’s the same structure found on construction sites, refineries, manufacturing plants, and emergency response jobs across the country. OSHA’s investigation didn’t stop at the bottom of the chain with just the subcontractors. Federal inspectors opened three separate inspections and cited all three companies:
- The subcontractor that supplied cleanup laborers received 18 willful egregious violations and 5 serious violations, with proposed penalties of $3,045,452. This was after investigators found workers were sent into the spill area without adequate training, respirator fit testing, or basic safety measures.
- The remediation contractor was cited for 2 willful and 5 serious violations, carrying proposed penalties of $392,501, tied to gaps in training, an emergency response plan for hazardous waste operations, and respirator program deficiencies.
- The host facility that owned the tank that ruptured received 6 serious violations and $82,750 in proposed penalties for exposing workers to chemical burns and hazmat and respirator training failures.
Combined, the proposed penalties across the three employers total $3,520,703.
The regulatory principle at work
This is a textbook application of OSHA's Multi-Employer Citation Policy (CPL 02-00-124), which allows the agency to cite more than one employer on a single worksite for the same hazardous condition. Under that framework, OSHA evaluates who created a hazard, who was exposed to it, who had the power to correct it, and who controlled the site. Any employer who fits one of those four descriptions can be held liable regardless of whose name is on the paycheck.
OSHA's Assistant Secretary for Occupational Safety and Health described the failures by saying the three employers had full knowledge of the severe hazards and bypassed federal requirements anyway and called the failure to protect workers a choice rather than an oversight lapse.
What this means for your operation
If your company hires subcontractors, staffing agencies, or if you are one of those subcontractors working someone else's site, this case is a reminder that:
- Contractual boundaries do not equal regulatory boundaries. OSHA does not care who is named in the service agreement. Their focus is on who created, controlled, or was exposed to the hazard.
- “We hired someone qualified" is not a defense. Controlling and host employers have a duty to verify that contractors and subcontractors have adequate training, PPE, respiratory protection programs, and emergency response plans in place.
- Emergency response and cleanup work carries its own regulatory obligations that are distinct from the incident that triggered it and are under standards covering hazardous waste operations and emergency response (HAZWOPER), respiratory protection, and general PPE.
- Willful and egregious classifications multiply exposure fast. The largest penalty in this case came not from the party that owned the facility, but from the staffing firm several links down the contracting chain, proving that penalty exposure follows the hazard, not the organizational chart.
Keys to remember: Whatever the ultimate outcome may be for an incident; the enforcement pattern proves that for multi-employer worksites, safety responsibilities aren’t something you can subcontract away.

NewsIndustry NewsIndustry NewsEnforcement and Audits - OSHAEnforcement and Audits - OSHASafety & HealthConstruction SafetyGeneral Industry SafetyMaritime SafetyOccupational Safety and Health Administration (OSHA), DOLEnglishFocus AreaUSA
2026-07-06T05:00:00Z
OSHA publishes long-awaited Regulatory Agenda
After failing to publish a Fall 2025 or Spring 2026 regulatory agenda, on July 3 OSHA published a 2026 Regulatory Plan and the Unified Agenda of Federal Regulatory and Deregulatory Actions. Of note, a Subpoenas interim final rule is up for November 2026, the Emergency Response final rule is set for April 2027, and the Heat proposal is slated to be finalized in October 2027.
Starting August 19, 2026, OSHA will hold public hearings on numerous proposed rules, most of which relate to respiratory protection requirements for different chemical substances. The others relate to construction illumination, safety color code for marking for physical hazards, limiting the General Duty Clause for inherently risky professional activities, and fixed ladders.
Four rules fell into the long-term action category from the proposed or final stages in 2025: Communication Tower Safety, Shipyard Fall Protection, Powered Industrial Trucks Design Standard Update, and Standards Improvement Project. Long-term actions are items the agency considers under development but does not expect to take regulatory action on within 12 months after publication of the most recent regulatory agenda.
| Final rule stage | |
| Projected publication date | Title |
| July 2026 |
|
| September 2026 |
|
| November 2026 |
|
| April 2027 |
|
| October 2027 |
|
| Proposed rule stage | |
| Projected publication date or other action | Title |
| July 2026 |
|
| August 2026 - public hearings |
|
| September 2026 |
|
| November 2026 |
|
| December 2026 - Supplemental Notice of Proposed Rulemaking |
|
| Long-term actions | |
| |

NewsFormaldehydeMethylene ChlorideEnglishAsbestosCadmiumIndustry NewsIndustry NewsLeadSafety & HealthGeneral Industry SafetyToxic and Hazardous Substances - OSHAAcrylonitrileEthylene OxideFocus AreaToxic and Hazardous Substances - OSHAUSA
2026-07-22T05:00:00Z
OSHA reopens comment period for 13 proposed rules
OSHA has reopened the comment period for 13 chemical-specific proposed rules. The August 21 deadline provides the public 30 days to comment on recommendations made by OSHA’s Advisory Committee on Construction Safety and Health (ACCSH). The rules are:
- 1,2-dibromo-3-chloropropane
- 1, 3- Butadiene
- 13 Carcinogens (4- Nitrobiphenyl, etc.)
- Acrylonitrile
- Asbestos
- Cadmium
- Ethylene Oxide
- Formaldehyde
- Inorganic Arsenic
- Lead
- Methylene Chloride
- Methylenedianiline
- Vinyl Chloride
The proposed rules were originally published in the Federal Register on July 1, 2025. At that time, OSHA was in the process of appointing members to ACCSH. The agency stated that it would present the proposed rules to ACCSH once that process was complete and would allow the public time to provide comments on the recommendations.
To read or download the ACCSH recommendations, comments, and other materials submitted in the docket, visit www.regulations.gov.

NewsFire Protection and PreventionIn-Depth ArticleEnglishEmergency Planning - OSHAIndustry NewsSafety & HealthEmergency PreparednessEmergency Planning (OSHA)Emergency ExitsExit RoutesConstruction SafetyGeneral Industry SafetyAgriculture SafetyMaritime SafetyFire Protection and PreventionMine SafetyFocus AreaUSA
2023-12-28T06:00:00Z
Does my office need an exit sign?
One of the most common questions inspectors get when evaluating workplace emergency safeguards is, “Does my office need an exit sign?” Section 29 CFR 1910.37 requires employers to provide specific safeguards and operational features for exit routes. OSHA’s intent is to minimize danger to employees and requiring proper exit route marking is one way to do so.
In short, smaller rooms or offices with only one door don’t necessarily need an exit sign. OSHA standards for exit signage are based on NFPA 101, Life Safety Code, which OSHA incorporated by reference. OSHA 1910.37(b)(4) states, “If the direction of travel to the exit or exit discharge is not immediately apparent, signs must be posted along the exit access indicating the direction of travel to the nearest exit and exit discharge. Additionally, the line-of-sight to an exit sign must clearly be visible at all times.”
Other exit signage requirements to consider
The International Fire Code (IFC) was not adopted by OSHA; however, it’s likely to be referenced by local fire marshals. The IFC states, “Exit signs are not required in rooms or areas that require only one exit or exit access.” Generally, a room or area that holds fewer than 50 people is permitted to have only one exit. These rooms are typically smaller with an exit that is close and obvious, so an exit sign shouldn’t be needed inside the room. For example, individual offices, small conference rooms, storage rooms, and bathrooms usually don’t have exit signs because the way out is obvious.
Additional requirements for office exits require they:
- Are free of obstructions. No materials or equipment may be placed, either permanently or temporarily, within the exit route.
- Are arranged so that employees aren’t required to travel toward a high hazard area unless the path of travel is effectively shielded from the high hazard area by suitable partitions or other physical barriers.
- Don’t pass through a room that can be locked, such as a bathroom, to reach an exit or exit discharge, or lead into a dead-end corridor.
- Are adequately lighted so that an employee with normal vision can see along the exit route.
- Have each exit route door be free of decorations or signs that obscure the visibility of the exit route door.
Key to remember
When considering exit signs for smaller offices, employers must determine the size of the room, path of travel to an exit, and how obvious the exit would be based on room size. Generally, a room intended to hold fewer than 50 people is permitted to have only one exit and would not require an exit sign.

NewsIndustry NewsSafety & HealthConstruction SafetyGeneral Industry SafetyGeneral Duty ClauseIn-Depth ArticleEnglishGeneral Duty ClauseFocus AreaUSA
2026-07-22T05:00:00Z
When summer shows up, so do the bugs
Heat stress isn't the only outdoor hazard that ramps up during the summer months. While hydration and cooling strategies are essential, employers shouldn't overlook the insects that emerge with the warmer weather. Ticks, mosquitoes, bees, and wasps can expose workers to diseases, allergic reactions, and other serious health risks that deserve the same level of attention as the heat.
Bug-proofing your workers
Preventing insect and tick exposures doesn't require a complicated program. The goal is to help workers recognize the hazards they may encounter, take simple precautions, and reduce the chances that a routine bite or sting turns into a serious injury, illness, or medical emergency. A few practical steps can go a long way:
- Build awareness. Make sure workers know what they might encounter, where exposures are most likely, and what symptoms to watch for.
- Provide protection. Keep insect repellent, appropriate clothing, and any needed PPE available when work may involve exposure.
- Reduce the risk at the source. Control standing water, trim vegetation, and inspect equipment, materials, and work areas for nests before work begins.
- Be prepared to respond. Have first aid supplies readily available and establish a process for reporting bites, stings, and signs of illness.
- Know your workforce. Understand whether employees have severe insect-sting allergies and ensure appropriate emergency response procedures are in place.
- Make prevention part of the routine. Include insect hazards in pre-task planning, keep repellent accessible in vehicles and job boxes, and encourage tick checks at the end of the day.
- Track incidents and trends. Document bites, stings, and insect-related illnesses so recurring hazards can be identified and addressed.
More than just nuisance bugs
Workers don’t have to be deep in the woods to face risks from insects and ticks. Exposure can happen during routine tasks along fence lines, near drainage ditches, around overgrown vegetation, or when working on equipment that has been sitting unused.
Ticks thrive in grassy, brushy areas and can attach to a worker without being noticed. Mosquitoes breed in standing water and become especially active during warmer months. Bees and wasps often build nests in structures, underground, or inside equipment and materials, creating unexpected hazards in active work areas.
These exposures are more than a minor annoyance. Stings can trigger severe allergic reactions, including anaphylaxis, a life-threatening medical emergency that requires immediate treatment. Ticks and mosquitoes can also transmit diseases such as Lyme disease, West Nile virus, and other illnesses that may not appear until days or even weeks after exposure.
The potential consequences are real. According to CDC data, 788 people in the United States died from bee, wasp, and hornet stings between 2011 and 2021, an average of about 72 deaths each year, with most fatalities linked to severe allergic reactions. What may seem like a routine outdoor task can quickly become a serious medical event if insect and tick hazards are overlooked.
Indoors, outdoors, both covered
OSHA doesn't have a standard devoted solely to insect hazards in outdoor work environments. However, under the General Duty Clause, employers are responsible for protecting workers from recognized hazards, which can include exposures such as ticks in brushy areas or wasps nesting on equipment and structures.
For indoor and enclosed workspaces, OSHA is more direct. The vermin control provisions of the Sanitation standard, 29 CFR 1910.141(a)(5), require employers to maintain workplaces in a manner that prevents insects and other pests from entering or nesting and to implement an effective extermination program when infestations are present.
Whether the concern is a tick-infested worksite, standing water attracting mosquitoes, or a wasp nest tucked inside a job trailer, employers should take reasonable steps to identify and control these hazards before workers are exposed.
Key to remember: Insect hazards can show up in just about any work environment. A little awareness and a few simple controls can help keep a routine bite or sting from turning into something more serious. Bugs may be part of the job, but being unprepared for them doesn't have to be.
NewsIndustry NewsSafety & HealthGeneral Industry SafetyWalking Working SurfacesIn-Depth ArticleWalking Working SurfacesLaddersEnglishFocus AreaUSA
2025-07-24T05:00:00Z
Misconceptions on dock chains, wheel chocks, fixed ladders and more
Our experts regularly receive questions on loading docks and fall protection, particularly since OSHA revised the regulations in 2017. Here are answers to some of common questions.
Can we use rope or chain as fall protection on loading docks?
Yes, if you install it correctly. Most docks are four feet or higher and require fall protection if the door is open without a trailer in place. Rope or chain must be equivalent to a guardrail, which requires a top rail and mid rail. A single chain is not acceptable.
Per 1910.29(b), the material must be at least one-quarter inch in diameter. The top rail must be 42 inches high, plus or minus 3 inches, for a range of 39 to 45 inches. The top rail cannot sag or deflect to within 39 inches of the surface under 200 pounds of force, and should be tight enough to prevent a worker from falling between the chains and the dock edge.
Are wheel chocks required at loading docks?
Employers must use some method to prevent the trailer from moving. OSHA gives examples of wheel chocks, but other options can work, such as dock locks. Even if the dock ramp is inclined downward, OSHA still requires chocks.
Note that OSHA’s directive STD 01-11-007 uses the term “mechanical means” instead of the term “dock locks.” Also, a Letter of Interpretation dated March 7, 2011, clarified that the Federal Motor Carrier Safety Administration (FMSCA) provision for relying on trailer brakes applies only to employers that are motor carriers. Other employers must ensure that forklift operators secure the trailer from movement before entering.
Do fixed ladders need cages?
Fixed ladders over 24 feet high that were installed prior to November 19, 2018, must have a personal fall arrest system, ladder safety system, cage, or well per 1910.28(b)(9)(i)(A). Employers must update those ladders with a fall arrest or ladder safety system by November 18, 2036.
OSHA previously required cages or wells on fixed ladders over 20 feet but removed that requirement in 2017. Employers often install cages on ladders under 24 feet for various reasons, such as limiting access, but OSHA does not require this. For related information, see our article, Planning fixed ladder fall protection upgrades.
Can we use designated areas on flat roofs?
A personal fall arrest or travel restraint system is required for work within 6 feet of the edge, but a designated area can be an option for work further from the edge. It can be used on low-slope roofs in two situations:
- If the work will be at least 6 feet (but less than 15 feet) from the edge, a designated area may be used if the work is infrequent and temporary, such as changing an air conditioner filter once per month.
- If employees will be working 15 feet or more from the edge, a designated area may be used even if the job will take several days or weeks.
Surprisingly, if employees will be at least 15 feet from the edge and the work qualifies as infrequent and temporary, no fall protection is required (not even a designated area). OSHA offered clarification on the terms “infrequent” and “temporary” in a Letter of Interpretation dated June 12, 2020.
Key to remember: The fall protection requirements in the Walking-Working Surface regulations raise many questions, but OSHA has published some clarifying guidance.
Saved to my EVENT CALENDAR!
View your saved links by clicking the arrow next to your profile picture located in the header. Then, click “My Activity” to view the Event Calendar on your Activity page.
OK
J. J. Keller is the trusted source for DOT / Transportation, OSHA / Workplace Safety, Human Resources, Construction Safety and Hazmat / Hazardous Materials regulation compliance products and services. J. J. Keller helps you increase safety awareness, reduce risk, follow best practices, improve safety training, and stay current with changing regulations.
Copyright 2026 J. J. Keller & Associate, Inc. For re-use options please contact copyright@jjkeller.com or call 800-558-5011.