Knowing the bottlenecks can help change outcomes
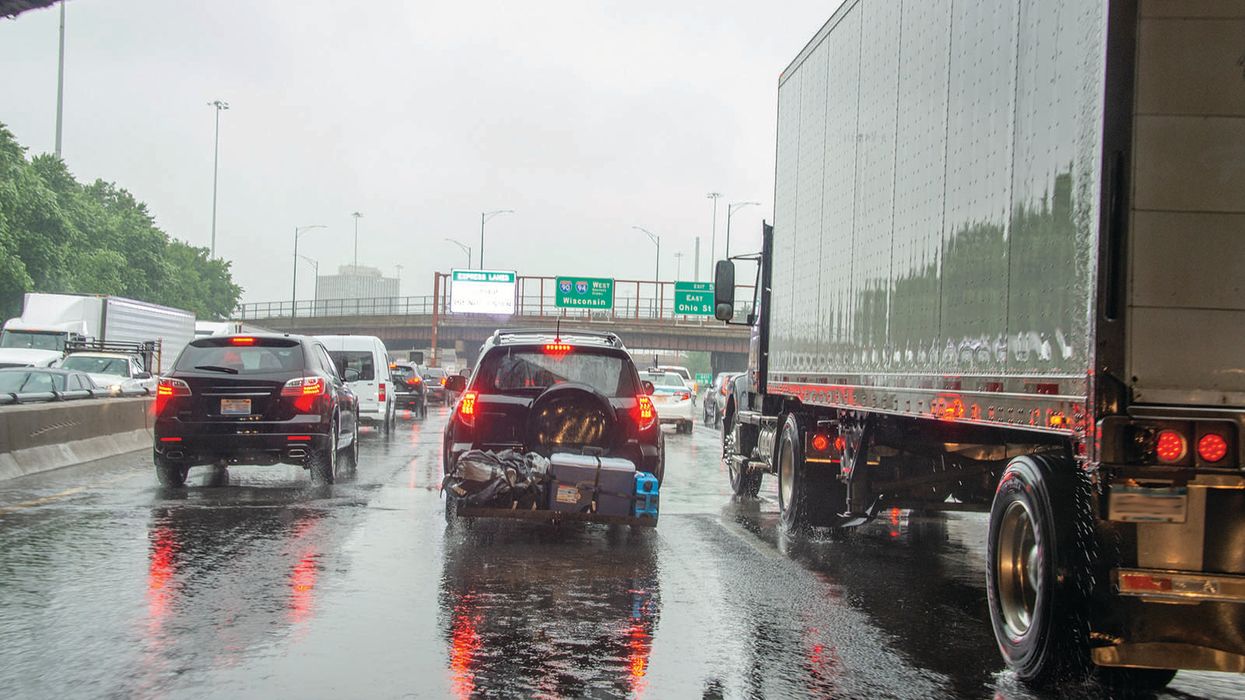
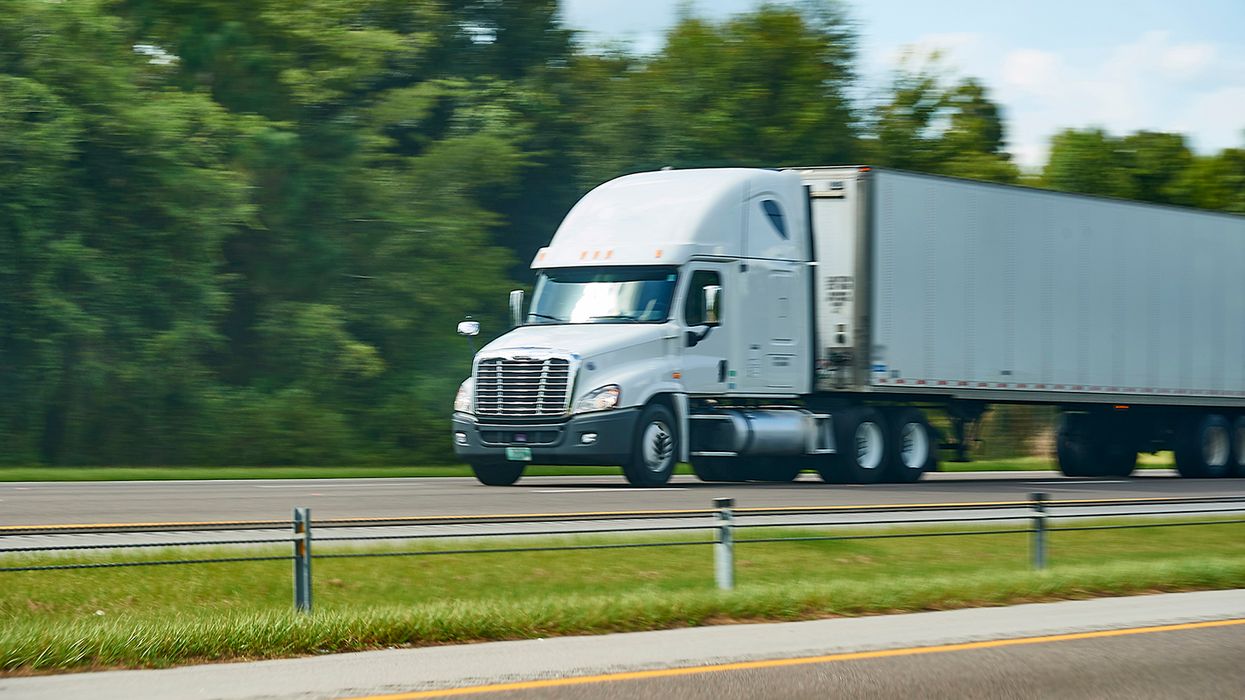
Each year, the American Transportation Research Institute (ATRI) conducts a study that converts truck GPS data into an ongoing truck bottleneck analysis. Using the data in this study can help a company devise schedules and routes to reduce the odds of a delay or an accident. If rerouting is not possible, at least knowing about the delays caused by the congestion in these areas will help with making scheduling estimates and adjustments.
And the winners are!
Here are the top 20 bottlenecks:
- Fort Lee, NJ: I-95 at SR 4
- Chicago, IL: I-294 at I-290/I-88
- Houston, TX: I-45 at I-69/US 59
- Atlanta, GA: I-285 at I-85 (North)
- Atlanta, GA: I-20 at I-285 (West)
- Chicago, IL: I-290 at I-90/I-94
- Los Angeles, CA: SR 60 at SR 57
- Los Angeles, CA: I-710 at I-105
- Nashville, TN: I-24/I-40 at I-440 (East)
- San Bernardino, CA: I-10 at I-15
- Houston, TX: I-10 at I-45
- Chicago, IL: I-80 at I-94
- McDonough, GA: I-75
- Atlanta, GA: I-285 at SR 400
- Cincinnati, OH: I-71 at I-75
- Dallas, TX: I-45 at I-30
- Atlanta, GA: I-20 at I-285 (East)
- Atlanta, GA: I-75 at I-285 (North)
- Houston, TX: I-45 at I-610 (North)
- Baton Rouge, LA: I-10 at I-110
While some of the bottlenecks are constant, other bottlenecks are tied to peak travel periods (“rush hours”). As an example, Fort Lee, NJ, has an average daily speed of 26.8 mph, with peak and non-peak speeds of 20.2 mph and 29.5 mph, respectively. The low average speed and low non-peak speed would indicate the bottle neck is nearly constant. On the other hand, Nashville, TN, has an average speed of 41.4, with peak and non-peak speeds of 30.6 mph and 46.2 mph, indicating the peak times are more of an issue.
Use this information!
As well as delaying the movement of freight, these bottlenecks have other consequences. They cost drivers available hours. The problem is a driver driving at 20 mph for two hours rather than 40 mph for one hour will use twice as many available hours to get through that area. Also, going through a congested area at peak times exposes your vehicles to more risk when it comes to accidents.
Share this data with your drivers
If possible, allow your drivers to adjust their schedules and routes to work around these bottlenecks, rather than having to go through them during peak periods.
Key to remember: Knowing where and when bottlenecks typically occur gives you and your drivers the ability to plan around them.

