Two-part article: Finding Compliance ROI - Part 2
This is the second article in a two-part series. If you have not already, read part one of this two-part article.
The cost and impact of non-compliance with FMCSA (Federal Motor Carrier Safety Administration) regulations fall primarily into seven areas: the cost of an accident, the expense of litigation, fines associated with violations, insurance premiums, lost productivity, driver turnover, and loss of business. In part one, we covered the return on investment due to reducing accidents, litigation, and fines by maintaining an effective safety and compliance program. Compliance return on investment (ROI) is created whenever one of these seven occurs less frequently. In this article we will review the remaining four.
Insurance premiums
In a recent study, the American Transportation Research Institute (ATRI) shared that premium costs per mile for insurance increased overall by 47 percent over the last ten years, from $0.059 to $0.087 Increasing insurance premiums paired with the 967 percent increase in average verdict size for truck crashes have squeezed motor carrier revenue.
Many consider insurance a gamble, a risk they take or do not take. Every month they bet their premium amount that they are going to have an accident, and every month the insurance provider bets the limits of coverage that there will be no accident. It is not a fair bet. The “house,” or the coverage provider, needs to understand the “odds” in detail to win. In fact, they hire specialists to calculate the risk of having to pay out. These specialists are called underwriters.
Underwriters do not guess. They use facts and statistics. They consider:
- A carrier’s accident history,
- Roadside inspection violation history,
- Driver citation history from motor vehicle records (MVRs),
- The total miles and where a carrier runs, and
- Operation type
Underwriters are interested in a carrier’s compliance trendlines and what safety programs they follow. Without good collaborating data of the carrier’s safety program, the underwriter may assume that the investments are not in place. Or, if it is and the data is not provided, the information paints a high-risk picture.
Lost productivity
Every time a driver is delayed moving from Point A to Point B, productivity is lost. It does not matter if the operation is paid to move product or people from Point A to Point B, whether the operation is moving their own goods or people from Point A to Point B, or work needs to get done at Point B. If a driver is delayed, there is no way to get the time back. Time, as the adage goes, is money. Depending on the bill rate, a single hour of lost productivity over the road can equal hundreds or thousands of dollars.
Vehicle breakdowns are a double penalty. Certainly, there is lost productivity, but the second factor is the over-the-road repair expense. Tow trucks and third-party shops are typically much more expensive than a “home” or trusted local shop.
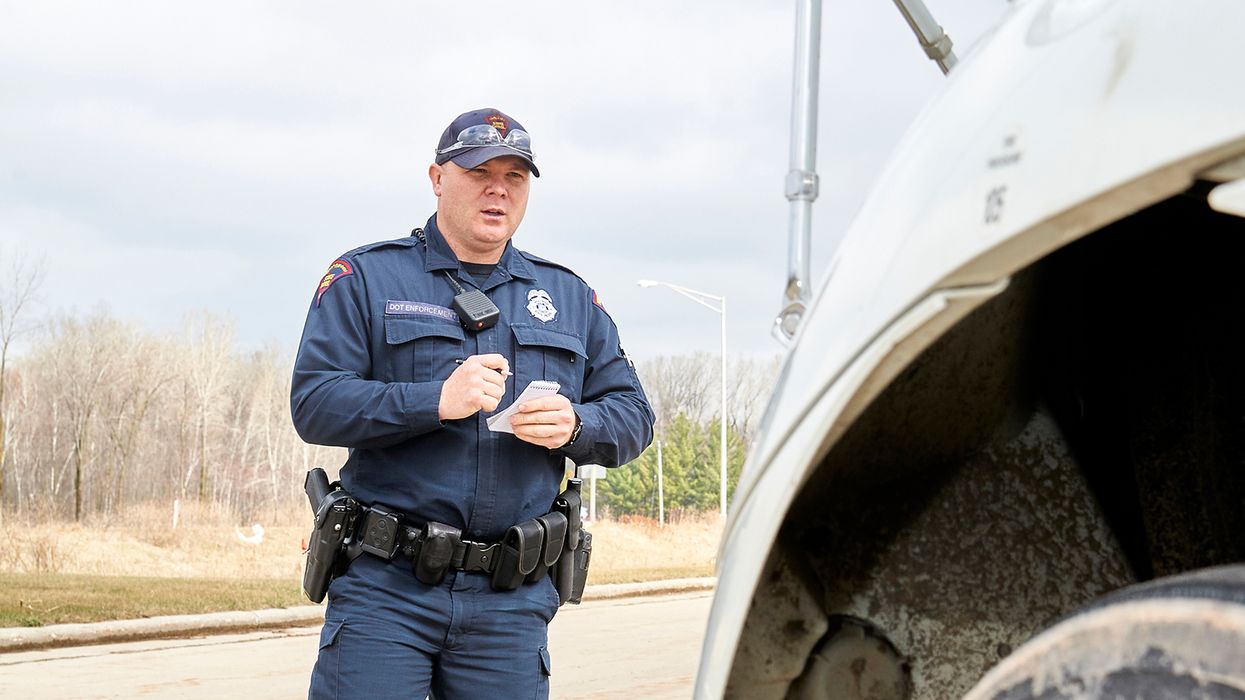
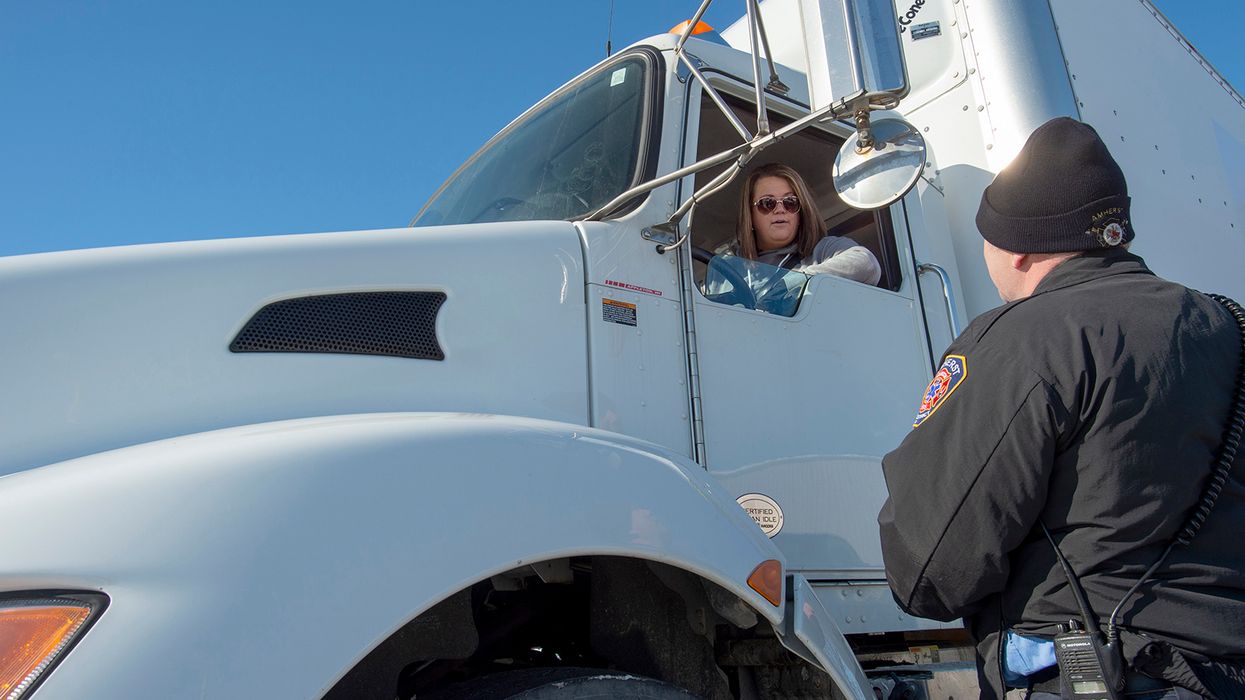
Every year the FMCSA, through the Compliance Safety Accountability (CSA) program, inspects millions of drivers and vehicles. If a driver or vehicle is deemed unsafe, either can be placed out of service. Out-of-service orders can easily stretch into hours – even days.
Last year, over 860,000 drivers or vehicles were shut down due to roadside inspections:
- 21.6% of the time a vehicle violation was found, the vehicle was placed out of service, and
- 22.% of the time a driver violation was found, the driver was placed out of service.
Concerning ROI, when no violations are found at roadside inspections no lost time is incurred.
Driver turnover
Good drivers want to work for safe and compliant carriers. Drivers realize that they have CSA Safety Measurement Scores as well. A driver’s roadside inspection violations stay on the books for three years instead of two for carriers.
Driver complaints are the second most common reason that carriers are “chosen” for a compliance review.
Depending on the carriers interviewed for a driver-turnover survey, the cost of replacing a driver can range from $2,000.00 to $20,000.00.
The average cost of replacing a driver that never quits due to the carrier having an effective and fair safety management program is $0.00.
Loss of business
Customers care about a carrier’s safety culture. In this litigious society, they are not free of the risk of becoming embroiled in a lawsuit. A plaintiff’s attorney could claim that the customer has vicarious liability because they did not do their due diligence to ensure the carrier selected was safe, or the carrier has proven themselves to be unsafe.
A customer rarely shares the true reason “they are going a different direction,” often chalking up the move to another provider of services as a price or leadership decision. Both may be true, the cost of continuing the relationship is simply too high due to the risk and leadership has instructed the contact to find a new vendor.
Key to remember
Calculating ROI is difficult. As a rule, the ROI of safety and compliance does not bring any revenue into the door. The primary ROI of compliance and safety programs is ensuring that the hard-earned revenue makes it to the bottom line.


