Compliance Just Got Easier: Stay ahead of regulatory changes with instant notifications on updates that matter.
['Hazmat: Highway', 'Hazmat']
['Hazmat security plans', 'Loading and unloading - Hazmat', 'Hazmat Enforcement', 'Hazmat Incident reporting']
2023-11-17T06:00:00Z
JOIN TODAY TO CONTINUE READING THIS ARTICLE & OTHER INDUSTRY NEWS!
You'll also get exclusive access to:
A database of easy-to-understand regulationsAsk unlimited questions to our expertsPre-led discussions forumsAnd more
TRY IT FREE TODAY
Already have an account? Log in now.

Copyright 2026 J. J. Keller & Associate, Inc. For re-use options please contact copyright@jjkeller.com or call 800-558-5011.
NewsIndustry NewsHazmat SafetyHazmat Incident reportingHazmat: HighwayHazmatIn-Depth ArticleLoading and unloading - HazmatHazmat EnforcementEnglishFocus AreaTransportationHazmat security plansUSA
Data-driven detour: Use hazmat incident numbers to map your training efforts
2023-11-17T06:00:00Z
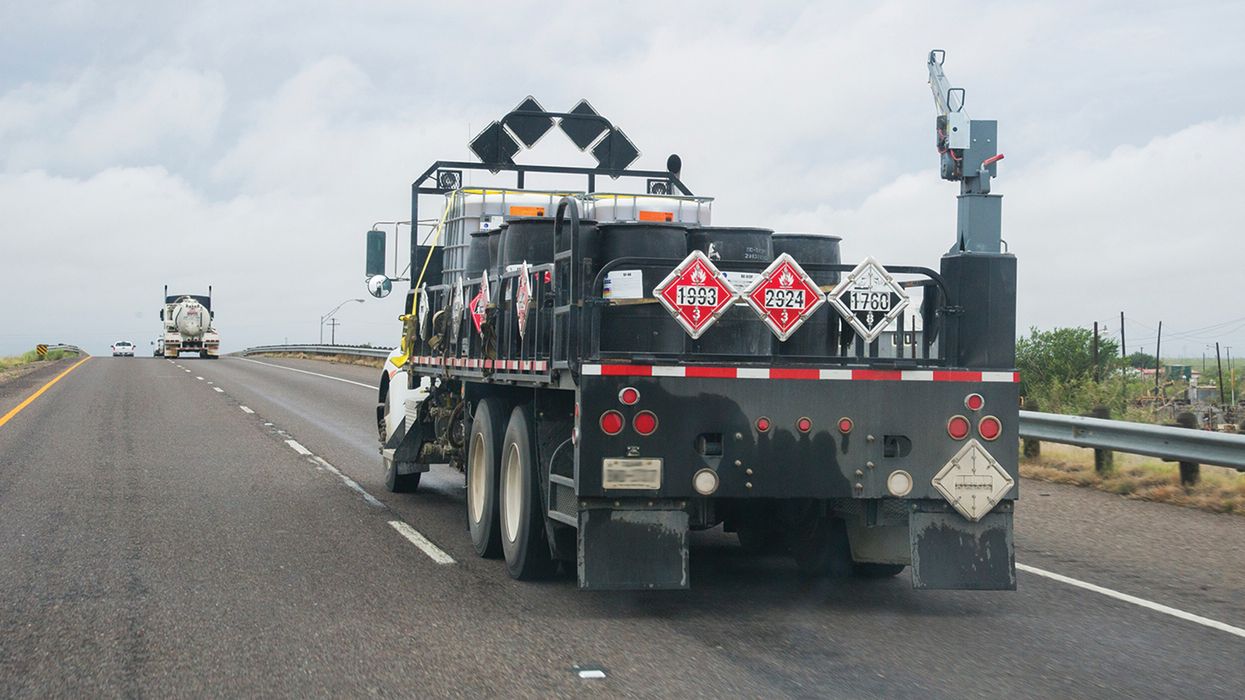
So far this year, 18,496 hazmat incidents on highways have caused nearly $27 million in damages. Check out the following data to see where the problems occur. Then, use the information to analyze gaps, mitigate risk, and enhance safety in your own operations.
Highway incidents by transportation phase
The potential for hazmat incidents to occur exists in every phase of transportation, but some more than others.
| Transportation phase | # of Incidents | Damages |
|---|---|---|
| In transit | 6,401 | $22,048,112 |
| In-transit storage | 305 | $1,683,470 |
| Loading | 3,109 | $354,665 |
| Unloading | 8,681 | $2,495,526 |
The most common causes of incidents warrant thorough coverage in your hazmat training.
| Cause | # of Incidents | Damages |
|---|---|---|
| Loose closure, component, or device | 3,520 | $133,827 |
| Improper preparation for transportation | 2,469 | $997,966 |
| Human error | 1,776 | $1,375,258 |
| Dropped | 1,761 | $130,080 |
| Forklift accident | 1,010 | $1,761,549 |
Incident cause: Most expensive highway incidents
The most expensive incidents may happen less frequently, but their high cost is a strong incentive to fortify efforts to avoid them.
| Cause | # of Incidents | Damages |
|---|---|---|
| Vehicular crash or accident damage | 41 | $3,848,179 |
| Rollover accident | 24 | $2,521,449 |
| Impact with sharp or protruding object (e.g., nails) | 899 | $1,818,157 |
| Forklift accident | 1,010 | $1,761,549 |
| Fire, temperature, or heat | 13 | $1,490,449 |
The data in the tables is current as of September 15, 2023.
Key to remember: Knowledge is power. Use available accident data to focus your safety programs and training efforts where they can have the greatest impact.
NewsIndustry NewsHazmat SafetyHazmat Incident reportingHazmat: HighwayHazmatIn-Depth ArticleLoading and unloading - HazmatHazmat EnforcementEnglishFocus AreaTransportationHazmat security plansUSA
Data-driven detour: Use hazmat incident numbers to map your training efforts
2023-11-17T06:00:00Z
So far this year, 18,496 hazmat incidents on highways have caused nearly $27 million in damages. Check out the following data to see where the problems occur. Then, use the information to analyze gaps, mitigate risk, and enhance safety in your own operations.
Highway incidents by transportation phase
The potential for hazmat incidents to occur exists in every phase of transportation, but some more than others.
| Transportation phase | # of Incidents | Damages |
|---|---|---|
| In transit | 6,401 | $22,048,112 |
| In-transit storage | 305 | $1,683,470 |
| Loading | 3,109 | $354,665 |
| Unloading | 8,681 | $2,495,526 |
The most common causes of incidents warrant thorough coverage in your hazmat training.
| Cause | # of Incidents | Damages |
|---|---|---|
| Loose closure, component, or device | 3,520 | $133,827 |
| Improper preparation for transportation | 2,469 | $997,966 |
| Human error | 1,776 | $1,375,258 |
| Dropped | 1,761 | $130,080 |
| Forklift accident | 1,010 | $1,761,549 |
Incident cause: Most expensive highway incidents
The most expensive incidents may happen less frequently, but their high cost is a strong incentive to fortify efforts to avoid them.
| Cause | # of Incidents | Damages |
|---|---|---|
| Vehicular crash or accident damage | 41 | $3,848,179 |
| Rollover accident | 24 | $2,521,449 |
| Impact with sharp or protruding object (e.g., nails) | 899 | $1,818,157 |
| Forklift accident | 1,010 | $1,761,549 |
| Fire, temperature, or heat | 13 | $1,490,449 |
The data in the tables is current as of September 15, 2023.
Key to remember: Knowledge is power. Use available accident data to focus your safety programs and training efforts where they can have the greatest impact.


See More
RELATED NEWS


Specialized Industries
Go beyond the regulations! Visit the Institute for in-depth guidance on a wide range of compliance subjects in safety and health, transportation, environment, and human resources.
J. J. Keller® COMPLIANCE NETWORK is a premier online safety and compliance community, offering members exclusive access to timely regulatory content in workplace safety (OSHA), transportation (DOT), environment (EPA), and human resources (DOL).

Interact With Our Compliance Experts
Puzzled by a regulatory question or issue? Let our renowned experts provide the answers and get your business on track to full compliance!

Upcoming Events
Reference the Compliance Network Safety Calendar to keep track of upcoming safety and compliance events. Browse by industry or search by keyword to see relevant dates and observances, including national safety months, compliance deadlines, and more.

SAFETY & COMPLIANCE NEWS
Keep up with the latest regulatory developments from OSHA, DOT, EPA, DOL, and more.


REGSENSE® REGULATORY REFERENCE
Explore a comprehensive database of word-for-word regulations on a wide range of compliance topics, with simplified explanations and best practices advice from our experts.

THE J. J. KELLER INSTITUTE
The Institute is your destination for in-depth content on 120+ compliance subjects. Discover articles, videos, and interactive exercises that will strengthen your understanding of regulatory concepts relevant to your business.


ADD HAZMAT, ENVIRONMENTAL, & HR RESOURCES
Unlock exclusive content offering expert insights into hazmat, environmental, and human resources compliance with a COMPLIANCE NETWORK EDGE membership.

DIRECT ACCESS TO COMPLIANCE EXPERTS
Struggling with a compliance challenge? Get the solution from our in-house team of experts! You can submit a question to our experts by email, set up a phone or video call, or request a detailed research report.


EVENTS
Register to attend live online events hosted by our experts. These webcasts and virtual conferences feature engaging discussions on important compliance topics in a casual, knowledge-sharing environment.
Most Recent Highlights In Environmental

NewsIndustry NewsWater PermittingPoint SourcesWater ProgramsEnvironmental Protection Agency (EPA)Industrial WastewaterEnvironmentalIn-Depth ArticleWater ProgramsUSAEnglishFocus AreaCWA Compliance
2026-04-16T05:00:00Z
Effluent limitations: FAQs for direct dischargers of industrial wastewater
Facilities across the country conduct industrial activities that generate wastewater containing pollutants and then release it directly into nearby surface waters, such as streams, rivers, or lakes. However, before any industrial wastewater can be discharged from a site, the facility must obtain a National Pollutant Discharge Elimination System (NPDES) permit.
The Environmental Protection Agency (EPA) uses effluent limitations as the primary method to regulate direct discharges of industrial wastewater into waters of the United States. These restrictions are incorporated into NPDES permits.
Meeting effluent limitations is the key to compliance with NPDES permits. But like other environmental regulations, these standards can get complex quickly without a solid foundation of understanding. We’ve compiled common FAQs to help you become fluent in effluent limitations.
What’s effluent?
There’s no specific statutory or regulatory definition of “effluent.” Thankfully, a 1997 document from EPA entitled Terms of Environment: Glossary, Abbreviations, and Acronyms, Revised December 1997 (EPA 175-B-97-001) provides clarity, defining effluent as “wastewater — treated or untreated — that flows out of a treatment plant, sewer, or industrial outfall.”
What’s the difference between effluent guidelines and limitations?
There are subtle but important distinctions between these two terms.
Effluent guidelines (also known as effluent limitations guidelines and standards or ELGs) are the national industrial wastewater discharge standards established by EPA for all facilities in an industrial category.
The federal agency develops effluent guidelines based on the performance of the best available technology that’s economically achievable for an industry. Notably, effluent guidelines are technology-based; they’re not based on risk or impacts to receiving waters (i.e., water quality-based).
Federal effluent guidelines (40 CFR Subchapter N) for direct dischargers of industrial wastewater are implemented through the NPDES permitting program.
Effluent limitations are any restrictions imposed “on quantities, discharge rates, and concentrations of pollutants” from industrial wastewater discharges (122.2). Simply put, effluent limitations are the specific numeric and non-numeric requirements developed for facilities to comply with the effluent guidelines. Unlike effluent guidelines, effluent limitations may be both technology- and water quality-based.
Most states issue NPDES permits, except for the District of Columbia, Massachusetts, New Hampshire, and New Mexico, where EPA serves as the permitting authority. The permit writer develops effluent limitations for NPDES permits and issues them to facilities. The permit may be general (covering multiple facilities with similar operations and discharges) or individual (customized with site-specific conditions).
What’s the bottom line? Effluent guidelines aren’t directly enforceable permit conditions, whereas effluent limitations are.
What are the types of effluent limitations?
Two categories of effluent limitations may appear in NPDES permits:
- Technology-based effluent limitations (TBELs), and
- Water quality-based effluent limitations (WQBELs).
TBELs are based on available treatment technologies and require facilities to meet a minimum level of treatment of pollutants in wastewater discharges.
WQBELs apply only when TBELs aren’t enough to achieve water quality standards. States develop total maximum daily loads (TMDLs). A TMDL is the maximum amount of a pollutant that can be discharged into a waterbody while still meeting the water quality standards. Specific portions of the TMDL are then allotted to permitted facilities (called wasteload allocation). Facilities can’t release more than their allocated amounts.
Any applicable wasteload allocations are incorporated into a facility’s NPDES permit.
Do facilities have to use specific control technologies?
Although EPA’s effluent guidelines are based on the use of a specific control technology, facilities aren’t required to install the same technology system. As long as they comply with the standards, facilities may implement other treatment technologies.
Key to remember: Understanding effluent limitations is key to complying with industrial wastewater discharge permits.

NewsClosuresIndustry NewsIndustry NewsWaste/HazWasteWasteEnvironmental Protection Agency (EPA)Waste ManagementEnvironmentalSolid WasteEnglishFocus AreaUSA
2026-04-16T05:00:00Z
EPA proposes major changes to coal combustion residuals rules
The Environmental Protection Agency (EPA) published a proposed rule on April 13, 2026, to revise the existing regulations governing the disposal of coal combustion residuals (CCR) in landfills and surface impoundments as well as the beneficial use of CCR.
Who’s impacted?
The proposed rule affects coal-fired electric utilities and independent power producers subject to the CCR disposal and beneficial use regulations at 40 CFR Part 257.
What are the changes?
Significant changes the EPA proposes include:
- Adding an option for facilities to certify the closure of legacy CCR surface impoundments by CCR removal that were closed before November 8, 2024, under regulatory oversight;
- Expanding the eligibility criteria for facilities to defer CCR closure requirements until site-specific determinations are made for legacy surface impoundments that were closed before November 8, 2024, under regulatory oversight;
- Exempting CCR dewatering structures (used to dewater CCR waste for the disposal of CCR elsewhere) from federal CCR regulations (Part 257);
- Rescinding all CCR management unit (CCRMU) requirements or revising the existing CCRMU regulations;
- Allowing permit authorities to make site-specific determinations regarding certain requirements during permitting for CCR units complying with federal CCR groundwater monitoring, corrective action, and closure requirements under a federal or an approved-state CCR permit; and
- Revising the beneficial use requirements by:
- Removing the environmental demonstration requirement for non-roadway use of more than 12,400 tons of unencapsulated CCR; and
- Excluding these beneficial uses from federal CCR regulations (Part 257):
- CCR used in cement manufacturing at cement kilns,
- Flue gas desulfurization (FGD) gypsum used in agriculture, and
- FGD gypsum used in wallboard.
Key to remember: EPA plans to make significant amendments to the coal combustion residuals requirements.

NewsHazardous WasteIndustry NewsEnglishWaste ManifestsSafety & HealthGeneral Industry SafetyWasteEnvironmentalIn-Depth ArticleEnvironmental Management SystemsFocus AreaUSA
2026-04-14T05:00:00Z
What to know about EPA’s proposed manifest sunset rule
The Environmental Protection Agency (EPA) is taking another major step toward modernizing hazardous waste tracking. The agency’s proposed “manifest sunset rule” would officially phase out paper hazardous waste manifests and require the exclusive use of the e-Manifest system. For employers, especially those generating or managing hazardous waste, it’s a fundamental shift in how waste shipments are documented, tracked, and audited.
Since 2018, EPA’s e-Manifest system has been available as a digital alternative to paper manifests. Over the years, the agency has added requirements pushing the industry toward adoption, including mandatory registration and electronic data submission. But despite those efforts, many companies have continued to rely on paper manifests, either out of habit, for convenience, or because parts of their waste chain weren’t ready to go digital. EPA even states in the proposed rule that fewer than 1 percent of all e-Manifest users have completely switched to digital manifests. The proposed sunset rule is designed to close that gap. Once finalized, it would set a firm deadline (24 months) after which paper manifests would no longer be allowed.
Why EPA wants to eliminate paper manifests
EPA’s reasoning is pretty straightforward. Paper manifests are slower, easier to lose, and more prone to errors. They rely on manual handling and delayed processing, which can create gaps in tracking and compliance. A fully electronic system, on the other hand, allows for real-time visibility, standardized data entry, and faster correction of mistakes. It also gives regulators a clearer, more immediate picture of what’s happening across the entire waste life cycle.
Addressing one of the biggest digital barriers: signatures
One overlooked part of the proposed rule is how EPA is trying to solve one of the biggest barriers to going fully digital, which is signatures in the field. Anyone who has dealt with manifests knows that the weak point is often the hand-off between the generator and the transporter, especially when drivers don’t have system access or reliable connectivity.
To address that, EPA is proposing new functionality that would allow users to sign manifests using quick response (QR) codes or even short message service (SMS). In practice, this could mean a driver scans a QR code or receives a text prompt and then completes the signature process directly on the phone. So, no login or full system access is needed. EPA is also exploring the ability to use SMS and QR-based tools to make updates to manifest data without needing full system permissions. That’s a big deal operationally because it removes one of the most common bottlenecks in needing a registered user at a specific site to make even minor corrections.
Operational challenges companies should expect
With that said, moving to a fully digital system still comes with potential issues. It requires coordination across your entire operation. Generators, transporters, and disposal facilities all have to be aligned and capable of using the system effectively. If one party in that chain struggles, it can create delays or compliance issues for everyone involved. There’s also an upfront investment to consider. Companies may need to upgrade internal systems, ensure reliable connectivity, and train employees in new work processes. For organizations with multiple sites or field operations, this can take some planning. But over time, many of those burdens are expected to decrease. Electronic signatures, reusable templates, and centralized recordkeeping can significantly reduce administrative work.
One of the biggest shifts employers will notice is the level of visibility. With paper manifests, there’s often a lag between shipment and final documentation. In a digital system, that lag disappears. Information becomes available almost immediately, and regulators have access to the same data. That means errors or discrepancies are easier to find and harder to ignore.
The good news is that companies don’t have to wait for the final rule to start preparing. Taking a close look at your current manifest process is a good first step. If paper is still a major part of your workflow, that’s a clear signal that changes are coming. Making sure your e-Manifest account is fully set up and that employees understand how to use it will go a long way in avoiding future disruptions.
Keys to remember: The EPA’s proposed Paper Manifest Sunset Rule would set a firm date to phase out paper hazardous waste manifests and require that all covered shipments be tracked through the agency’s electronic e‑Manifest system, through which the Agency says will improve hazardous waste tracking and transparency while reducing administrative burden and saving regulated entities roughly $28.5 million per year.

NewsIndustry NewsCAA ComplianceEnvironmentalIn-Depth ArticleFocus AreaEnglishAir PermittingAir ProgramsUSA
2026-04-13T05:00:00Z
How incinerators are permitted: A look at the regulatory framework and EPA’s new streamlining proposal
Incinerators in the United States operate under a complex permitting framework designed to protect air quality, public health, and the environment. Under the Clean Air Act (CAA), facilities that burn waste must meet strict emission standards, maintain operating controls, and follow extensive monitoring and reporting rules. These requirements ensure that incineration, while a valuable tool for waste management, wildfire mitigation, and disaster recovery, remains safe and consistent with federal air quality objectives. Against this backdrop, the Environmental Protection Agency (EPA) recently proposed a rule to streamline permitting for specific types of incinerators used in wildfire prevention and disaster cleanup, a move that could reduce delays for state and local governments.
The regulatory basis for incinerator permitting
Most incinerators fall under Section 129 of the CAA, which mandates EPA to establish performance standards and emission guidelines for categories of solid waste combustion units. These standards govern pollutants such as particulate matter, carbon monoxide, sulfur dioxide, nitrogen oxides, lead, cadmium, mercury, hydrogen chloride, and dioxins/furans. Operators must also conduct emissions testing, maintain continuous monitoring equipment, track operational parameters, and submit regular compliance reports.
Permitting generally occurs through Title V operating permits, which consolidate all applicable air quality requirements into a single enforceable document. A Title V permit typically requires annual certifications, detailed recordkeeping, periodic emissions tests, and reporting of deviations. While the Title V program doesn't impose new standards, it ensures that incinerators comply with all existing federal and state air quality rules.
Different categories of incinerators, such as large municipal waste combustors (LMWC), small municipal waste combustors (SMWC), commercial and industrial solid waste incinerators (CISWI), and other solid waste incinerators (OSWI), have distinct requirements. These subcategories reflect variations in unit size, waste composition, and operational design, and each has its own subpart under EPA’s air quality regulations.
Air curtain incinerators: A special case
Air curtain incinerators (ACIs), which burn wood waste, yard debris, and clean lumber, occupy a niche segment of the permitting landscape. They use a mechanized “curtain” of air to increase combustion efficiency and reduce particulate emissions compared to open burning. However, their regulatory treatment has historically been inconsistent.
Because ACIs fit partly within several existing subparts, operators often face confusion about which monitoring, opacity limits, and reporting duties apply. Overlap across four regulatory categories can create delays, particularly during emergencies when ACIs are deployed to remove vegetative fuels that increase wildfire risk or to process debris after storms.
EPA’s emergent focus on streamlining
In March 2026, EPA announced a proposal to consolidate the regulatory requirements for ACIs used solely to burn wood-derived materials into a single subpart under Section 129 of the CAA. The proposal would also allow these ACIs to operate without a Title V permit unless located at a facility that otherwise requires one.
EPA stated that the change would “cut red tape” and provide clarity for state, local, and Tribal governments, allowing them to respond more effectively to natural disasters and conduct wildfire mitigation activities without unnecessary administrative delays. The agency emphasized that unprocessed debris contributes to poor air and water quality and poses safety risks, particularly in post disaster environments.
Context: Broader federal actions on disaster-related incineration
The proposal follows earlier federal steps to ease the temporary use of incinerators during emergencies. In 2025, EPA issued an interim final rule permitting CISWI units to burn nonhazardous disaster debris for up to 8 weeks without prior EPA approval, a provision intended to accelerate cleanup after hurricanes, wildfires, and floods. These units must still operate their pollution control equipment, and extensions beyond 8 weeks require EPA authorization.
Such measures reflect the increasing volume of debris associated with severe weather events and the need for rapid, environmentally sound disposal mechanisms. The current proposal for ACIs builds on these efforts by targeting the specific regulatory bottlenecks associated with vegetative and wood waste disposal.
Looking ahead
EPA’s streamlined permitting proposal doesn't alter emission standards but rather clarifies and simplifies administrative pathways. If finalized, it may make ACIs more accessible during periods of heightened wildfire risk and in the critical early stages of disaster recovery.
Key to remember: At its core, the permitting system for incinerators aims to balance environmental protection with operational flexibility. The new proposal underscores EPA’s recognition that, in emergency contexts, speed matters but so does environmental stewardship.

NewsIndustry NewsIndustry NewsToxic Substances Control Act - EPAToxic Subtances Control Act - EPATSCA ComplianceToxic Substances - EPAEnvironmental Protection Agency (EPA)EnvironmentalEnglishFocus AreaUSA
2026-04-13T05:00:00Z
EPA delays TSCA Section 8(a)(7) PFAS reporting timeline again
On April 13, 2026, the Environmental Protection Agency (EPA) published a final rule that further delays the submission period for the one-time report required of manufacturers on per- and polyfluoroalkyl substances (PFAS) by the PFAS Reporting and Recordkeeping Rule (PFAS Reporting Rule).
This final rule pushes the starting submission period to either 60 days after the effective date of a future final rule updating the PFAS Reporting Rule or January 31, 2027, whichever is earlier.
Who’s impacted?
Established under Toxic Substances Control Act (TSCA) Section 8(a)(7), the PFAS Reporting Rule (40 CFR Part 705) requires any business that manufactured (including imported) any PFAS or PFAS-containing article between 2011 and 2022 to report. Covered manufacturers and importers must submit information on:
- Chemical identity, uses, and volumes made and processed;
- Byproducts;
- Environmental and health effects;
- Worker exposure; and
- Disposal.
What’s the new timeline?
The opening submission period was moved from April 13, 2026, to either 60 days after the effective date of a future final PFAS Reporting Rule or January 31, 2027, whichever is earlier.
Most manufacturers have 6 months to submit the report. Small manufacturers reporting only as importers of PFAS-containing articles have 1 year.
| TSCA Section 8(a)(7) PFAS Reporting Rule submission period | ||
|---|---|---|
| Start date | End date | |
| Most manufacturers | 60 days from effective date of final PFAS Reporting Rule or January 31, 2027 (whichever is earlier) | 6 months from start date or July 31, 2027 (whichever is earlier) |
| Small manufacturers reporting solely as PFAS article importers | 60 days from effective date of final PFAS Reporting Rule or January 31, 2027 (whichever is earlier) | 1 year from start date or January 31, 2028 (whichever is earlier) |
Why the delay?
In November 2025, the agency proposed updates to the PFAS Reporting Rule. EPA has delayed the reporting period to give the agency time to issue a final rule (expected later this year).
Key to remember: EPA has delayed the starting submission deadline for the TSCA Section 8(a)(7) PFAS Reporting Rule from April 2026 to no later than January 2027.
Most Recent Highlights In Transportation

NewsGreenhouse GasesIndustry NewsIndustry NewsAir ProgramsEnvironmental Protection Agency (EPA)CAA ComplianceEnvironmentalFocus AreaEnglishVolatile Organic CompoundsAir ProgramsStationary Emission SourcesUSA
2026-04-10T05:00:00Z
EPA amends specific oil and gas emission standards
On April 9, 2026, the Environmental Protection Agency (EPA) published a final rule that makes technical changes to the emission standards established in March 2024 (2024 Final Rule) for crude oil and natural gas facilities. This rule (2026 Final Rule) amends the requirements for:
- Temporary flaring of associated gas, and
- Vent gas net heating value (NHV) monitoring provisions for flares and enclosed combustion devices (ECDs).
Who’s impacted?
The 2026 Final Rule affects new and existing oil and gas facilities. Specifically, it applies to the regulations for the Crude Oil and Natural Gas source category, including the:
- New Source Performance Standards at 40 CFR 60 Subpart OOOOb, and
- Emission guidelines at 60 Subpart OOOOc.
These emission standards are commonly referred to as OOOOb/c.
What are the changes?
The 2026 Final Rule implements technical changes to the temporary flaring and vent gas NHV monitoring requirements set by the 2024 Final Rule.
Temporary flaring
The rule extends the baseline time limit for temporary flaring of associated gas at well sites in certain situations (like conducting repairs or maintenance) from 24 to 72 hours. Owners and operators must stop temporary flaring as soon as the situation is resolved or the temporary flaring limit is reached (whichever happens first).
It also grants allowances beyond the 72-hour limit if exigent circumstances occur (such as severe weather that prevents safe access to a well site to address an emergency or maintenance issue) and there’s a need to extend duration for repairs, maintenance, or safety issues. Owners and operators must keep records of exigent circumstances and include the information in their annual reports.
NHV monitoring
For new and existing sources, the 2026 Final Rule exempts all flare types (unassisted and assisted) and ECDs from monitoring due to high NHV content, except when inert gases are added to the process streams or for other scenarios that decrease the NHV content of the inlet stream gas. In these cases, EPA requires NHV monitoring via continuous monitoring or the alternative performance test (sampling demonstration) option for all flares and ECDs.
Other significant changes include:
- Replacing the general exemption from NHV monitoring for associated gas for any control device used at well site affected facilities with NHV monitoring requirements,
- Granting operational pauses during weekends and holidays for the consecutive 14-day sampling demonstration requirements (limiting it to no more than 3 operating days from the previous sampling day), and
- Permitting less than 1-hour sampling times for twice daily samples where low or intermittent flow makes it infeasible (as long as owners and operators report the sampling time used and the reason for the reduced time).
The 2026 Final Rule takes effect on June 8, 2026.
Key to remember: EPA’s technical changes to the emission standards for oil and gas facilities apply to temporary flaring provisions and vent gas NHV monitoring requirements.

NewsWaste ManifestsEnforcement and Audits - OSHAWaste/HazWasteWater ProgramsMonthly Roundup VideoCAA ComplianceUSACWA ComplianceStormwaterEnglishAir ProgramsIndustry NewsEnforcement and Audits - OSHAMunicipal WastewaterSafety & HealthGeneral Industry SafetyWasteEnvironmentalFocus AreaAir ProgramsVideo
EHS Monthly Round Up - March 2026
In this March 2026 roundup video, we'll review the most impactful environmental health and safety news.
Hi everyone! Welcome to the monthly news roundup video, where we’ll review the most impactful environmental health and safety news. Let’s take a look at what happened over the past month.
OSHA released an updated Job Safety and Health poster. Employers can use either the revised version or the older one, but the poster must be displayed in a conspicuous place where workers can easily see it.
OSHA recently removed a link from its Data topic webpage that displayed a list of “high-penalty cases” at or over $40,000 since 2015. The agency says it discontinued and removed it in December. The data is frozen and archived elsewhere.
OSHA published two new resources as part of its newly launched Safety Champions Program. The fact sheet provides an overview of how the program works, eligibility criteria, and key benefits. The step-by-step guide helps businesses navigate the core elements of OSHA’s Recommended Practices for Safety and Health Programs.
Several forces are nudging OSHA to address a number of workplace hazards and high-hazard industries. This comes from other agencies, safety organizations, watchdogs, legislative proposals, and persistent injury/fatality data. Among the hazards are combustible dust; first aid; personal protective equipment; and workplace violence. How all this translates into new regulations, guidance, programmed inspections, or other initiatives remains to be seen.
Turning to environmental news, EPA issued a proposed rule to require waste handlers to use electronic manifests to track all RCRA hazardous waste shipments. Stakeholders have until May 4 to comment on the proposal.
On March 10, EPA finalized stronger emission limits for new and existing large municipal waste combustors and made other changes to related standards.
And finally, EPA temporarily extended coverage under the 2021 Multi-Sector General Permit for industrial stormwater discharges until the agency issues a new general permit. The permit expired February 28 and remains in effect for facilities previously covered. EPA won’t take enforcement action against new facilities for unpermitted stormwater discharges if the facilities meet specific conditions.
Thanks for tuning in to the monthly news roundup. We’ll see you next month!

NewsIndustry NewsIndustry NewsMunicipal WastewaterPublicly Owned Treatment WorksSafe Drinking WaterWater ProgramsEnvironmental Protection Agency (EPA)EnvironmentalUSAWater ProgramsEnglishFocus AreaCWA Compliance
2026-04-07T05:00:00Z
EPA releases draft list of drinking water contaminants for possible regulation
The Environmental Protection Agency (EPA) published the draft Sixth Contaminant Candidate List (CCL 6) for the next group of contaminants to be considered for regulation under the Safe Drinking Water Act (SDWA). The agency’s proposed list designates microplastics and pharmaceuticals as priority contaminant groups for the first time.
What’s on the list?
The proposed CCL 6 contains:
- 4 chemical groups, including:
- Microplastics,
- Pharmaceuticals,
- Per- and polyfluoroalkyl substances (PFAS), and
- Disinfection byproducts.
- 75 chemicals; and
- 9 microbes.
EPA may regulate the listed contaminants in the future.
What does the CCL do?
The drinking water CCL is the first part of the process to regulate contaminants in public water systems. The list identifies unregulated contaminants known or anticipated to be present in drinking water that pose the greatest health risk. It helps EPA prioritize which contaminants to evaluate for potential regulation.
The SDWA requires EPA to make regulatory determinations (i.e., whether to develop rules for a contaminant) for at least five contaminants listed on the CCL every 5 years. When the agency determines a contaminant needs to be regulated, it begins the rulemaking process to develop a National Primary Drinking Water Regulation (NPDWR) for the contaminant. The NPDWRs apply to public water systems.
How can I participate?
EPA will receive public comments on the CCL 6 through June 5, 2026. You can send comments to EPA via regulations.gov or by mail. Make sure your submission includes the Docket ID No. EPA-HQ-OW-2022-0946.
Key to remember: The draft list of the next round of drinking water contaminants to be considered for regulation adds priority groups for microplastics and pharmaceuticals.

NewsIndustry NewsIndustry NewsEnvironmental Protection Agency (EPA)Renewable and Alternative EnergyBiofuelCAA ComplianceEnvironmentalRenewable and Alternative EnergyFocus AreaEnglishAir ProgramsAir ProgramsUSA
2026-04-03T05:00:00Z
EPA delivers 2026–2027 renewable fuel volumes
On April 1, 2026, the Environmental Protection Agency (EPA) published the “Set 2” Rule, establishing the Renewable Fuel Standard (RFS) program’s 2026 and 2027 renewable fuel volumes and associated percentage standards for:
- Cellulosic biofuel,
- Biomass-based diesel (BBD),
- Advanced biofuel, and
- Total renewable fuel.
The final rule also implements other significant changes.
Who’s impacted?
The “Set 2” Rule affects:
- Transportation fuel (i.e., gasoline and diesel) refiners, blenders, marketers, distributors, importers, and exporters; and
- Renewable fuel producers and importers.
The volume and percentage requirements apply to obligated parties, which include transportation fuel refiners and importers.
What are the changes?
The final rule sets the renewable fuel volume requirements and associated percentage standards for 2026 and 2027. Volume requirements are measured in billion Renewable Identification Numbers (RINs). One RIN represents 1 gallon of ethanol-equivalent renewable fuel.
| Renewable fuel category | Volume requirements (in billion RINs) | Percentage standards | ||
|---|---|---|---|---|
| 2026 | 2027 | 2026 | 2027 | |
| Cellulosic biofuel | 1.36 | 1.43 | 0.79% | 0.84% |
| BBD | 9.07 | 9.20 | 5.24% | 5.37% |
| Advanced biofuel | 11.10 | 11.32 | 6.42% | 6.61% |
| Total renewable fuel | 26.81 | 27.02 | 15.50% | 15.78% |
The “Set 2” Rule also:
- Reallocates 70 percent of the exempted Renewable Volume Obligations (RVOs) for 2023–2025 to 2026 and 2027 (which are reflected in the above table’s volume requirements),
- Partially waives the 2025 cellulosic biofuel volume requirement from 1.38 billion RINs to 1.21 billion RINs and adjusts the related percentage standard from 0.81 percent to 0.71 percent, and
- Removes renewable electricity as a qualifying renewable fuel under the RFS program.
RFS program refresher
The RFS program requires transportation fuel sold in the United States to contain a minimum volume of renewable fuels. EPA sets the renewable fuel volume targets for each of the four renewable fuel categories.
To comply, obligated parties must:
- Calculate their RVOs for each renewable fuel category, and
- Obtain and retire enough RINs to meet their RVOs.
Regulations also apply to fuel blenders, marketers, and exporters.
Small refiners may petition EPA for a small refinery exemption (SRE), which allows refineries to produce gasoline and diesel without having to meet the RVOs required by the RFS program. EPA grants SREs annually, and they cover one specific compliance year.
Key to remember: EPA’s final “Set 2” rule establishes the renewable fuel volumes and percentage standards for 2026 and 2027 and drives other changes to the RFS program.

NewsAir QualityIndustry NewsIndustry NewsAir ProgramsEnvironmental Protection Agency (EPA)Hazardous Air PollutantsCAA ComplianceEnvironmentalFocus AreaEnglishAir ProgramsStationary Emission SourcesUSA
2026-04-02T05:00:00Z
EPA releases final NESHAP for chemical manufacturing area sources
The Environmental Protection Agency (EPA) published a final rule on April 1, 2026, amending the National Emission Standards for Hazardous Air Pollutants (NESHAP) for Chemical Manufacturing Area Sources (CMAS). The NESHAP controls hazardous air pollutant (HAP) emissions from facilities that manufacture a range of chemicals and products, such as inorganic chemicals, plastics, and synthetic rubber.
Who’s impacted?
The final rule applies to nine area source categories in the chemical manufacturing sector that are regulated by the CMAS NESHAP (40 CFR 63 Subpart VVVVVV).
What are the changes?
EPA’s final rule:
- Establishes leak detection and repair requirements for equipment leaks and heat exchange systems in organic HAP service,
- Adds detectable emissions monitoring standards for pressure vessels in organic HAP service and emission management practice standards for pressure relief devices (PRDs) in organic HAP service,
- Prohibits closed vent systems in organic HAP service from bypassing an air pollution control device (APCD), and
- Requires recurring performance testing of non-flare APCDs to demonstrate compliance with process vent and storage tank provisions.
The final rule also mandates electronic reporting for notifications of compliance status (NOCs), performance test reports, and periodic reports. Facilities must submit these reports through the Compliance and Emissions Data Reporting Interface (CEDRI) on EPA’s Central Data Exchange.
What didn’t change?
Significantly, the final rule doesn’t add previously proposed regulations for area sources that use ethylene oxide (EtO) to produce materials described by code 325 of the North American Industry Classification System (NAICS).
EPA states that it intends to address the regulation of EtO from area sources and major sources in one final action.
What are the compliance timelines?
Existing facilities must comply with the amendments by April 1, 2029.
New facilities (those that begin construction or reconstruction after January 22, 2025) have to comply with the changes by April 1, 2026, or upon startup, whichever is later.
Additionally, facilities must start electronically submitting:
- Performance tests by June 1, 2026;
- NOCs by August 31, 2026; and
- Periodic reports by April 1, 2029.
Key to remember: EPA’s final HAP emissions rule for chemical manufacturing area sources adds new requirements for certain processing equipment and systems.
Most Recent Highlights In Safety & Health

NewsTier II Inventory ReportingIndustry NewsCERCLA, SARA, EPCRACommunity Right to KnowEmergency Release PlanningEnvironmental Protection Agency (EPA)EnvironmentalIn-Depth ArticleEnglishSARA ComplianceFocus AreaUSA
2026-03-31T05:00:00Z
EPCRA inventory reports: A case study in federal, state, and local collaboration
Environmental regulations require many facilities to report annual inventories of the hazardous chemicals they use or store. Have you ever considered the impact that this information has beyond regulatory compliance? Reporting facilities, whether they realize it or not, serve an essential role in local emergency response planning.
The Environmental Protection Agency’s (EPA’s) Hazardous Chemical Inventory Reporting program under the Emergency Planning and Community Right-to-Know Act (EPCRA) offers a prime example of how collaboration among the federal, state, local, and facility levels supports safer communities.
What’s EPCRA's inventory reporting program?
The Occupational Safety and Health Administration (OSHA) requires facilities to keep Safety Data Sheets (SDSs) for any hazardous chemical used or stored in the workplace. Facilities that use or store the chemicals on-site at or above certain thresholds at any one time are subject to EPCRA’s Hazardous Chemical Inventory Reporting program. Regulated facilities must report information about the hazardous chemicals to the:
- State Emergency Response Commission (SERC),
- Local Emergency Planning Committee (LEPC), and
- Local fire department.
What’s reported?
EPA’s EPCRA inventory program consists of two reporting requirements under Sections 311 and 312 of EPCRA.
SDSs/lists
Section 311 of EPCRA requires facilities to submit the SDSs for or a list of the hazardous chemicals used or stored on-site at or above the reporting thresholds to the SERC, LEPC, and local fire department.
SDSs usually include comprehensive information, such as:
- The composition of ingredients,
- Physical and health hazard information, and
- First aid and firefighting measures.
If a facility opts to list the chemicals, it must group them by hazard categories and include each chemical’s name and any hazardous components as identified by the SDS. This is generally a one-time submission for each hazardous chemical. However, if a facility submits an SDS for a hazardous chemical and later discovers significant new information about it, the facility has to send an updated SDS to the SERC, LEPC, and local fire department.
Annual inventories
Under Section 312 of EPCRA, facilities must also submit an annual inventory (known as the Tier II inventory report) of the hazardous chemicals used or stored on-site at or above the reporting thresholds to the SERC, LEPC, and local fire department by March 1.
Facilities should check state regulations to confirm Tier II reporting thresholds, as they may be more stringent.
The Tier II inventory report requires information on the covered hazardous chemicals used or stored at the facility during the previous calendar year, including:
- The locations of the chemicals,
- The amounts of the chemicals, and
- The potential hazards of the chemicals.
How do inventories support emergency planning?
Inventory reports provide information that’s vital to effective emergency response planning. Specifically, the inventories tell state and local officials about where hazardous chemical releases may occur and the risks that such releases may pose. Equipped with an accurate view of these hazards, officials can build and maintain effective emergency response plans for their communities.
Each participant in the emergency planning effort plays a distinct role:
- Reporting facilities provide the SERCs, LEPCs, and local fire departments with the information they need to build effective response plans, such as the types of chemicals on-site and their quantities, locations, and possible hazards.
- SERCs designate local emergency planning districts and appoint and supervise LEPCs. They also establish the inventory reporting procedures, review local emergency response plans, and process information requests from the public.
- LEPCs use inventory reports to develop and update emergency response plans that address each community’s unique risks.
- Local fire departments use the inventory reports to understand the potential chemical-related risks they may encounter at specific facilities. By knowing where the chemicals are and the potential hazards they pose, fire departments can improve personnel training and identify the most appropriate ways to respond to chemical emergencies.
Ultimately, reporting facilities aren’t just meeting a compliance requirement; they’re also supporting safer communities.
Key point: EPCRA’s hazardous chemical inventory requirements provide an example of effective collaboration between EPA, state and local officials, and facilities to prepare communities for chemical emergencies.
NewsIndustry NewsCERCLA, SARA, EPCRAToxics Release Inventory ReportingEnvironmentalIn-Depth ArticleEnglishSARA ComplianceFocus AreaUSA
2026-03-27T05:00:00Z
Expert Insights: Four commonly overlooked categories in TRI reporting
Toxics Release Inventory (TRI) reporting can be tricky, even for seasoned EHS teams. Many facilities meet all the requirements but still miss chemicals that should be reported. Most oversights fall into four key categories. Here’s what they are and why they get missed, along with a few simple examples that show up in routine operations.
Newly added or updated TRI chemicals
The TRI list changes more often than many people realize. The Environmental Protection Agency (EPA) regularly updates it and recently added new per- and polyfluoroalkyl substances (PFAS) and even a full diisononyl phthalate (DINP) chemical category. When facilities don’t review these updates each year, they may keep using materials that now contain reportable chemicals without realizing it. For example, PFAS were expanded for Reporting Years 2024 and 2025, and the DINP category was added in 2023. These changes mean that everyday items like coatings, lubricants, and flexible plastics can suddenly trigger TRI thresholds.
“Otherwise used” chemicals
Not every reportable chemical is manufactured or processed. Many are simply “otherwise used,” including solvents, degreasers, cleaners, and maintenance chemicals. Facilities often overlook these because they aren’t part of the product mix, but they can add up fast. Even common shop chemicals, when used across a year, can exceed the 10,000-pound threshold and require reporting.
Coincidentally manufactured byproducts
Some chemicals are created unintentionally during normal operations. Ammonia may form during baking or heating steps, nitrates often appear in wastewater treatment, and metal compounds can be generated during welding, machining, or corrosion. These substances count as “manufactured” under TRI even if they weren’t intentionally manufactured. Examples like ammonia, nitrates, metal compounds, and diesel byproducts such as naphthalene and polycyclic aromatic compounds are regularly overlooked in TRI reporting because they’re easy to underestimate.
Impurities or additives in mixtures
Many reportable chemicals hide inside mixtures, oils, coatings, lubricants, and chemical blends. If a facility focuses only on the main ingredients, it may miss the smaller additive or impurity that’s actually subject to TRI reporting. These overlooked components can push a facility over a reporting threshold, even when the product is used in small amounts.
TRI oversights usually occur not because facilities ignore the rules but because chemicals show up in unexpected forms. Keeping an eye on updates, tracking cleaners and maintenance chemicals, monitoring byproducts, and checking mixtures closely can prevent the most common reporting mistakes.

NewsIndustry NewsWaste/HazWasteSustainabilityCAA ComplianceSustainabilityIn-Depth ArticleCWA ComplianceEnvironmentalEnglishSustainabilityESG (Environmental, Social, and Governance)Focus AreaUSA
2026-03-25T05:00:00Z
The essential role of local governments in environmental regulation
Counties and municipalities play a major role in protecting air, water, and land resources across the United States. Although federal and state agencies establish the overarching environmental framework, thousands of local agencies conduct the day to day permitting, inspections, and enforcement needed to make those rules work.
Local governments obtain regulatory authority largely through delegation. Federal environmental laws such as the Clean Air Act, Clean Water Act, and Resource Conservation and Recovery Act (RCRA) allow the Environmental Protection Agency (EPA) to authorize state agencies, which may then rely on local entities to administer components of these programs. In many states, local districts, counties, or municipalities operate significant environmental programs directly under state authority.
Common local level programs
A strong example of local involvement can be seen in air quality management. The National Association of Clean Air Agencies (NACAA) reports that 117 local air agencies participate in implementing federal and state clean air programs, highlighting how implementation frequently happens at the local level.
EPA’s AirNow directory lists numerous local air quality agencies across the country; Examples include air pollution control districts in California (such as the Sacramento Metropolitan Air Quality Management District, the San Francisco Bay Area Air Quality Management District, and the South Coast Air Quality Management District) as well as local air programs in Maricopa County, Arizona; Jacksonville, Florida; and Omaha, Nebraska. These districts conduct inspections, issue permits, investigate complaints, and maintain air monitoring networks, all of which support state and federal clean air requirements.
Local authority is also central to solid waste management, where many states rely heavily on counties and municipalities to manage planning, facilities, and enforcement. For instance, Washington State requires local governments to develop comprehensive solid and hazardous waste management plans that guide all waste handling and recycling programs within each county or city. These plans determine facility needs, outline reduction and recycling strategies, and shape local ordinances designed to meet state goals.
Additional examples appear across the country. Maryland’s Montgomery County, California’s Alameda County, and the District of Columbia all implement ambitious local waste diversion plans that supplement or exceed state requirements, demonstrating how counties and cities directly shape waste reduction and recycling policy. Likewise, South Carolina places most solid waste management responsibility on county governments, which must develop local plans, designate recycling coordinators, and report progress toward statewide goals.
Why is local involvement critical?
Local environmental regulatory authority matters because conditions vary widely across the nation. Counties and municipalities better understand their own industries, land uses, and growth patterns, allowing them to respond quickly to complaints, target outreach effectively, and adopt ordinances that go beyond state or federal minimums when necessary. Their proximity to communities makes local agencies essential partners in achieving environmental compliance and advancing public health protections.
As federal and state programs evolve, the role of local agencies continues to expand. Air quality districts, solid waste authorities, and local environmental health departments all demonstrate how counties and municipalities contribute directly to national environmental objectives.
Key to remember: With thousands of local agencies responsible for on the ground regulatory tasks, the strength and responsiveness of the United States’ environmental protection system depend heavily on the active engagement of local governments.

NewsIndustry NewsCERCLA, SARA, EPCRACommunity Right to KnowToxics Release Inventory ReportingEnvironmental Protection Agency (EPA)EnvironmentalIn-Depth ArticleEnglishSARA ComplianceFocus AreaUSA
2026-03-24T05:00:00Z
Toxics Release Inventory: Are you ready to report?
Every year at the beginning of July, industrial facilities across the nation can breathe a collective sigh of relief — their annual inventories of toxic chemicals are complete! To ensure that your facility can be part of that celebration (and avoid a chaotic rush to meet the deadline), now’s the perfect time to start preparing for the Toxics Release Inventory (TRI).
The Environmental Protection Agency’s (EPA’s) TRI program requires industrial facilities to report waste management data on certain toxic chemicals they manufacture, process, and use by July 1 each year. Is your facility ready to report? Here’s an overview of the TRI program to help you answer this question.
Who’s covered by TRI reporting?
Generally, TRI reporting applies if the facility:
- Is in a covered industry sector (40 CFR 372.23);
- Employs 10 or more full-time-equivalent employees; and
- Manufactures, processes, or otherwise uses a covered chemical or chemical category (372.65) in quantities above the threshold levels (372.25, .27, and .28) in a given year.
TRI tip: The TRI reporting year (RY) reflects the calendar year covered by the report, not the year in which you submit the report. For example, TRI reports for RY 2025 are due by July 1, 2026.
What’s covered by TRI reporting?
Facilities must submit the TRI Form R (or the streamlined Form A Certification Statement if eligible) for each TRI-listed chemical manufactured, processed, or used during the previous calendar year. The data covers chemical waste management activities (including releases to the environment) and any actions taken to reduce or prevent chemical waste.
Facilities usually report for each chemical:
- The quantities of releases (routine and accidental),
- Any releases caused by catastrophic or other one-time events,
- The maximum amount on-site during the year, and
- The amount contained in wastes managed on-site or transferred off-site.
What’s new for RY 2025?
The TRI reports for RY 2025 contain three differences from previous years:
- The de minimis level for anthracene was lowered from 1.0 percent to 0.1 percent. Anthracene’s Chemical Abstracts Service Registry Number (CASRN) is 120-12-7.
- More activity sub-use codes were added to the sub-use codes for “processing” and “otherwise use” activities.
- Nine per- and polyfluoroalkyl substances (PFAS) were added to the TRI chemical list:
| EPA registry name | CASRN |
|---|---|
| 6:2 fluorotelomer sulfonate acid | 27619-97-2 |
| 6:2 fluorotelomer sulfonate ammonium salt | 59587-39-2 |
| 6:2 fluorotelomer sulfonate anion | 425670-75-3 |
| 6:2 fluorotelomer sulfonate potassium salt | 59587-38-1 |
| 6:2 fluorotelomer sulfonate sodium salt | 27619-94-9 |
| Acetic acid, [(.gamma.-.omega.-perfluoro-C8-10-alkyl)thio] derivs., Bu esters | 3030471-22-5 |
| Ammonium perfluorodecanoate | 3108-42-7 |
| Perfluoro-3-methoxypropanoic acid | 377-73-1 |
| Sodium perfluorodecanoate | 3830-45-3 |
How are TRI reports submitted?
Facilities must submit TRI reports electronically to the TRI-MEweb application on EPA’s Central Data Exchange (CDX). Even if a facility uses its own software to prepare TRI forms, it must upload and submit the forms to TRI-MEweb.
TRI tip: To complete the submission process on TRI-MEweb, you need to assign one user the Preparer role and another user the Certifying Official role. Ensure both users have added TRI-MEweb to their CDX user accounts.
TRI reports must be submitted to both EPA and the state. If your facility’s state participates in the TRI Data Exchange (TDX), TRI-MEweb will automatically send your report to the state. If your facility’s state doesn’t participate, you must send a hard copy of the report to the TRI state contact.
TRI tip: Use EPA’s “TRI Data Exchange” webpage to determine whether your facility’s state participates in TDX. As of March 2026, all 50 states participate in TDX. The District of Columbia doesn’t participate.
More TRI tips
Keep these things in mind when preparing your TRI reports:
- You must submit a Form R (or Form A if eligible) for each TRI-listed chemical your facility manufactured, processed, or otherwise used above the threshold quantity.
- TRI data is publicized. If a chemical’s identity needs to be protected, you have to submit substantiation forms to claim the chemical identity as a trade secret. EPA must approve the claims. Further, for each chemical with a trade secret claim, you have to mail hard copies of the substantiation forms and the corresponding Form Rs (or Form As if eligible) to EPA and the state.
- EPA’s online GuideME platform offers comprehensive guidance for TRI reporting, including reporting forms and instructions, the TRI chemical list, and Q&As.
- Contact the state environmental agency directly to confirm the submission method. EPA’s “TRI State Contacts” webpage contains state contact information.
- Register your facility on CDX or ensure your facility’s CDX account is updated as soon as possible to avoid delays caused by technical issues.
Start preparing for TRI reporting now to give your facility plenty of time to gather data, complete the forms, and respond to unexpected issues that could arise. That way, your facility can breathe easily throughout the whole reporting season.
Key to remember: The submission deadline for TRI reporting is July 1, 2026. Make sure your facility is ready to report.

NewsIndustry NewsIndustry NewsStationary Emission SourcesEnvironmental Protection Agency (EPA)Hazardous Air PollutantsCAA ComplianceEnvironmentalFocus AreaEnglishAir ProgramsAir ProgramsUSA
2026-03-19T05:00:00Z
Final rule adds EtO emission limits to polyether polyol production
The Environmental Protection Agency (EPA) finalized major changes to the National Emission Standards for Hazardous Air Pollutants (NESHAP) for Polyether Polyols (PEPO) Production (PEPO NESHAP).
Who’s impacted?
The final rule applies to facilities that produce polyether polyols and are subject to the regulations at 40 CFR 63 Subpart PPP.
What are the changes?
EPA’s final rule establishes ethylene oxide (EtO) standards, updates maximum achievable control technology (MACT) requirements, and revises other provisions for the PEPO NESHAP.
EtO standards
The final rule adds EtO emission standards for:
- Equipment leaks,
- Heat exchange systems,
- Process vents,
- Storage vessels, and
- Wastewater.
The standards set emission limits and add requirements for monitoring and leak repairs.
MACT standards
Further, the final rule:
- Requires heat exchange systems to use the more sensitive Modified El Paso Method (also known as the Air Stripping Method) for quarterly monitoring and a leak definition of 6.2 parts per million by volume of total strippable hydrocarbon concentration (as methane) in the stripping gas,
- Lowers the MACT control thresholds for batch process vents and storage vessels,
- Updates the requirements for internal floating roof storage vessels,
- Lowers the threshold for equipment leaks for valves in gas/vapor service or light liquid service, and
- Requires transfer operations with loading operations that exceed a certain threshold to use a vapor balance system or reduce emissions.
Other standards
EPA’s final rule also:
- Requires 5-year performance testing for process vent control devices;
- Revises flare monitoring and operational requirements to ensure they meet the MACT standards at all times when controlling hazardous air pollutant (HAP) emissions;
- Adds new monitoring requirements for pressure vessels to verify that no detectable emissions exist;
- Clarifies that any bypass of a pollution control device for closed vent systems is a violation;
- Aligns the requirements for surge control vessels and bottoms receivers with the process vent standards;
- Adds butylene oxide to the definition of “epoxide” and the HAPs list;
- Expands “affected source” to cover specific post-reaction processes; and
- Finalizes work practice standards for maintenance vents and equipment openings, storage vessel degassing, and routine storage vessel maintenance.
However, EPA didn’t finalize the 2024 proposed rule’s addition of a fenceline monitoring program for EtO or its changes to the continuous process vent standard.
What’s the compliance timeline?
Facilities subject to the PEPO NESHAP must comply with the changes by March 18, 2029, or upon startup, whichever is later.
Key to remember: EPA’s final rule for polyether polyol emissions makes significant changes, such as establishing EtO limits and revising MACT standards.
Most Recent Highlights In Human Resources

NewsIndustry NewsWater PermittingWater ProgramsEnvironmentalIn-Depth ArticleCWA ComplianceStormwaterEnglishFocus AreaUSA
2026-03-16T05:00:00Z
Key questions in industrial stormwater compliance
Industrial stormwater compliance can feel complex for facilities balancing operations, employees, and shifting permit requirements. Many questions center on the federal general permit, pollution prevention plan expectations, monitoring, and what to do in everyday situations where stormwater risks arise. The following sections summarize core topics and practical concerns.
What is the current status of the federal 2021 Multi-Sector General Permit (MSGP)?
EPA issued the current MSGP in 2021, and it remains in effect beyond its February 28, 2026 expiration until EPA finalizes the proposed 2026 MSGP. Because the proposed 2026 permit is still under review, the 2021 MSGP continues to govern covered facilities.
Why has the proposed 2026 MSGP not taken effect?
EPA released the proposed 2026 MSGP in December 2024. Public comments, including an extended comment period ending May 19, 2025, must be reviewed before finalizing the permit. Since the existing MSGP remains valid until replaced, the 2021 permit stays in force while EPA completes its process.
What is a Stormwater Pollution Prevention Plan (SWPPP)?
A SWPPP outlines how a facility prevents pollutants from reaching stormwater. It identifies pollutant sources, control measures, inspection routines, monitoring steps, and staff training. A SWPPP must be written before submitting a Notice of Intent (NOI) for permit coverage and updated when operations or stormwater risks change.
What are the requirements for authorized state stormwater permits?
Most states issue their own industrial stormwater permits modeled on the federal MSGP. These permits typically require:
- Preparation and maintenance of a SWPPP;
- Inspections and monitoring (such as benchmark, effluent, or visual monitoring);
- Corrective actions when control measures fail; and
- Reporting through state online systems.
States may add requirements based on local conditions. When EPA updates the MSGP, states often revise their permits to align with new federal standards.
Who needs coverage under the MSGP?
Industrial facilities that discharge stormwater to waters of the United States generally need permit coverage unless they qualify for a no‑exposure exclusion. The federal MSGP applies in areas where EPA, not the state, holds National Pollutant Discharge Elimination System (NPDES) authority.
How does a facility obtain coverage?
To obtain coverage, a facility must:
- Prepare and implement a SWPPP;
- Put pollution controls in place, such as good housekeeping and spill prevention;
- Identify sector specific requirements based on the permit; and
- Submit a Notice of Intent through EPA’s online system.
The proposed 2026 MSGP includes updated forms and appendices, but current requirements remain based on the 2021 version until a new permit is published.
What monitoring is required?
Under the 2021 MSGP, required monitoring may include:
- Quarterly visual assessments,
- Benchmark monitoring in designated years, and
- Effluent limitations monitoring for specific regulated discharges.
The proposed 2026 MSGP would expand per- and polyfluoroalkyl substances (PFAS) sampling, increase benchmark monitoring frequency, and add requirements for impaired waters. These changes remain pending.
What happens if benchmark thresholds are exceeded?
A benchmark exceedance requires the facility to investigate causes, improve control measures, and document actions in the SWPPP. The proposed 2026 MSGP would formalize additional implementation measures and reporting steps, but these wouldn’t apply until the new permit takes effect.
What about common real world compliance scenarios?
Industrial stormwater issues often arise from everyday activities. Consider these examples:
Employees’ vehicles leaking oil in parking lots
Leaks from employee vehicles can contaminate stormwater. While the MSGP does not regulate personal vehicles directly, the facility is responsible for any pollutants that enter stormwater from its property. Good housekeeping practices include absorbent stations, spill kits, drip pans, and designated parking areas with routine inspection.
Nonroutine outdoor maintenance
Temporary outdoor activities such as conducting maintenance, unloading equipment, or staging materials, can introduce pollutants. The SWPPP should address nonroutine tasks by requiring temporary controls like tarps, containment pads, or scheduling activities during dry weather. Documentation of these activities is also part of good recordkeeping.
Outdoor waste storage or scrap piles
These materials should be covered or sheltered, kept away from storm drains, and inspected frequently. If runoff contacts industrial materials, the discharge becomes regulated and must be managed under the permit.
These scenarios reinforce the need for strong housekeeping practices, staff training, and prompt corrective actions.
What documentation must facilities keep?
Facilities must maintain monitoring records, inspection logs, SWPPP updates, and corrective action reports. EPA may request these documents at any time. Appendices in the proposed 2026 MSGP preview updated forms, but the 2021 requirements remain in place for now.
What should facilities do while waiting for the 2026 MSGP?
Facilities should continue full compliance with the 2021 MSGP, track regulatory updates, and prepare for more frequent monitoring and PFAS sampling likely included in the 2026 permit. Reviewing proposed changes now helps facilities plan needed SWPPP updates in advance.
Key to remember: Industrial facilities covered under the 2021 MSGP or a state equivalent must continue following that permit until EPA issues a new federal MSGP. Staying informed, maintaining strong housekeeping, and keeping SWPPP documentation current remain the most effective strategies for compliance.
NewsIndustry NewsCERCLA, SARA, EPCRACommunity Right to KnowToxics Release Inventory ReportingEnvironmental Protection Agency (EPA)EnvironmentalIn-Depth ArticleEnglishSARA ComplianceFocus AreaUSA
2026-03-13T05:00:00Z
Toxics Release Inventory: Are you ready to report?
Every year at the beginning of July, industrial facilities across the nation can breathe a collective sigh of relief — their annual inventories of toxic chemicals are complete! To ensure that your facility can be part of that celebration (and avoid a chaotic rush to meet the deadline), now’s the perfect time to start preparing for the Toxics Release Inventory (TRI).
The Environmental Protection Agency’s (EPA’s) TRI program requires industrial facilities to report waste management data on certain toxic chemicals they manufacture, process, and use by July 1 each year. Is your facility ready to report? Here’s an overview of the TRI program to help you answer this question.
Who’s covered by TRI reporting?
Generally, TRI reporting applies if the facility:
- Is in a covered industry sector (40 CFR 372.23);
- Employs 10 or more full-time-equivalent employees; and
- Manufactures, processes, or otherwise uses a covered chemical or chemical category (372.65) in quantities above the threshold levels (372.25, .27, and .28) in a given year.
TRI tip: The TRI reporting year (RY) reflects the calendar year covered by the report, not the year in which you submit the report. For example, TRI reports for RY 2025 are due by July 1, 2026.
What’s covered by TRI reporting?
Facilities must submit the TRI Form R (or the streamlined Form A Certification Statement if eligible) for each TRI-listed chemical manufactured, processed, or used during the previous calendar year. The data covers chemical waste management activities (including releases to the environment) and any actions taken to reduce or prevent chemical waste.
Facilities usually report for each chemical:
- The quantities of releases (routine and accidental),
- Any releases caused by catastrophic or other one-time events,
- The maximum amount on-site during the year, and
- The amount contained in wastes managed on-site or transferred off-site.
What’s new for RY 2025?
The TRI reports for RY 2025 contain three differences from previous years:
- The de minimis level for anthracene was lowered from 1.0 percent to 0.1 percent. Anthracene’s Chemical Abstracts Service Registry Number (CASRN) is 120-12-7.
- More activity sub-use codes were added to the sub-use codes for “processing” and “otherwise use” activities.
- Nine per- and polyfluoroalkyl substances (PFAS) were added to the TRI chemical list:
| EPA registry name | CASRN |
|---|---|
| 6:2 fluorotelomer sulfonate acid | 27619-97-2 |
| 6:2 fluorotelomer sulfonate ammonium salt | 59587-39-2 |
| 6:2 fluorotelomer sulfonate anion | 425670-75-3 |
| 6:2 fluorotelomer sulfonate potassium salt | 59587-38-1 |
| 6:2 fluorotelomer sulfonate sodium salt | 27619-94-9 |
| Acetic acid, [(.gamma.-.omega.-perfluoro-C8-10-alkyl)thio] derivs., Bu esters | 3030471-22-5 |
| Ammonium perfluorodecanoate | 3108-42-7 |
| Perfluoro-3-methoxypropanoic acid | 377-73-1 |
| Sodium perfluorodecanoate | 3830-45-3 |
How are TRI reports submitted?
Facilities must submit TRI reports electronically to the TRI-MEweb application on EPA’s Central Data Exchange (CDX). Even if a facility uses its own software to prepare TRI forms, it must upload and submit the forms to TRI-MEweb.
TRI tip: To complete the submission process on TRI-MEweb, you need to assign one user the Preparer role and another user the Certifying Official role. Ensure both users have added TRI-MEweb to their CDX user accounts.
TRI reports must be submitted to both EPA and the state. If your facility’s state participates in the TRI Data Exchange (TDX), TRI-MEweb will automatically send your report to the state. If your facility’s state doesn’t participate, you must send a hard copy of the report to the TRI state contact.
TRI tip: Use EPA’s “TRI Data Exchange” webpage to determine whether your facility’s state participates in TDX. As of March 2026, all 50 states participate in TDX. The District of Columbia doesn’t participate.
More TRI tips
Keep these things in mind when preparing your TRI reports:
- You must submit a Form R (or Form A if eligible) for each TRI-listed chemical your facility manufactured, processed, or otherwise used above the threshold quantity.
- TRI data is publicized. If a chemical’s identity needs to be protected, you have to submit substantiation forms to claim the chemical identity as a trade secret. EPA must approve the claims. Further, for each chemical with a trade secret claim, you have to mail hard copies of the substantiation forms and the corresponding Form R (or Form A if eligible) to EPA and the state.
- EPA’s online GuideME platform offers comprehensive guidance for TRI reporting, including reporting forms and instructions, the TRI chemical list, and Q&As.
- Contact the state environmental agency directly to confirm the submission method. EPA’s “TRI State Contacts” webpage contains state contact information.
- Register your facility on CDX or ensure your facility’s CDX account is updated as soon as possible to avoid delays caused by technical issues.
Start preparing for TRI reporting now to give your facility plenty of time to gather data, complete the forms, and respond to unexpected issues that could arise. That way, your facility can breathe easily throughout the whole reporting season.
Key to remember: The submission deadline for TRI reporting is July 1, 2026. Make sure your facility is ready to report.

NewsAir QualityIndustry NewsIndustry NewsAir ProgramsAir EmissionsEnvironmental Protection Agency (EPA)CAA ComplianceEnvironmentalFocus AreaEnglishAir ProgramsStationary Emission SourcesUSA
2026-03-12T05:00:00Z
EPA finalizes emission standards for large municipal waste combustors
On March 10, 2026, the Environmental Protection Agency (EPA) finalized emission regulations for large municipal waste combustors (LMWCs). The final rule revises nearly all emission limits for new and existing LMWCs.
Who’s impacted?
The final rule applies to LMWCs that combust more than 250 tons per day of municipal solid waste and are covered by the:
- New Source Performance Standards (NSPS) for new LMWCs, or
- Emission Guidelines (EGs) for existing LMWCs.
EPA established new subparts for the amendments at 40 CFR Part 60, including:
- Subpart VVVV for the NSPS, and
- Subpart WWWW for the EGs.
What are the changes?
Generally, stricter emission limits apply. For all LMWCs (new and existing), the rule revises the emission limits for:
- Cadmium,
- Hydrogen chloride,
- Lead,
- Mercury,
- Particulate matter,
- Polychlorinated dibenzodioxins and dibenzofurans, and
- Sulfur dioxide.
For all new LMWCs, the final rule revises the emission limits for carbon monoxide (CO) and nitrogen oxides (NOx). The final rule also amends the CO and NOx limits for all existing LMWCs, except for the CO limits for two subcategories of combustors and the NOx limits for two subcategories of combustors for new municipal solid waste incinerators.
Other major changes include:
- Removing certain exclusions and exemptions for startups, shutdowns, and malfunctions (requiring LMWCs to meet emission standards at all times);
- Removing the NOx emissions averaging compliance alternative for existing LMWCs;
- Amending recordkeeping and reporting requirements; and
- Eliminating Title V operating air permit requirements for qualifying air curtain incinerators that burn only wood waste, yard waste, and clean lumber.
What’s the compliance timeline?
When EPA updates EGs, states must revise their State Implementation Plans (SIPs) to incorporate the changes. States have to submit revised SIPs by March 10, 2027. Once EPA approves the SIP, facilities with existing LMWCs must meet the new standards either within 3 years of the SIP’s approval date or by March 10, 2031, whichever is earlier.
New LMWCs must comply with the amended NSPS by September 10, 2026, or upon startup, whichever is later.
Key to remember: EPA finalized stronger emission limits for new and existing large municipal waste combustors and made other changes to the standards.

NewsGreenhouse GasesEnforcement and Audits - OSHAMonthly Roundup VideoWalking Working SurfacesCAA ComplianceUSAInjury and Illness RecordkeepingLaddersEnglishIndustry NewsEnforcement and Audits - OSHAOSHA InspectionsSafety & HealthInjury and Illness Recording CriteriaGeneral Industry SafetyEnvironmentalFocus AreaAir ProgramsVideo
EHS Monthly Round Up - February 2026
In this Februrary 2026 roundup video, we'll discuss the most impactful environmental health and safety news.
Hi everyone! Welcome to the monthly news roundup video, where we’ll review the most impactful environmental health and safety news. Let’s take a look at what happened over the past month.
Fatal work injuries fell 4 percent in 2024, largely due to a decline in workplace drug- and alcohol-related overdoses. According to the Bureau of Labor Statistics, overdose fatalities fell from 512 in 2023 to 410 in 2024. Across all types of workplace incidents, there were 5,070 fatal work injuries in 2024, compared to 5,283 in 2023. Transportation incidents continue to be the most frequent type of fatal event, accounting for over 38 percent of all occupational fatalities in 2024.
OSHA is fast-tracking a proposal to remove the 2036 obligation to upgrade fall protection systems on fixed ladders that extend over 24 feet. This follows an industry petition from major chemical and petroleum industry groups, which argue the provision is unjustified, costly, and not supported by the rulemaking record. OSHA frames the upcoming proposed action as deregulatory, allowing employers to update fixed ladders at the end of their service lives. We’ll provide updates as more information becomes available.
As OSHA leans into “deregulatory” actions, lawmakers are moving to pressure the agency to issue “regulatory” rulemaking to protect American workers. The latest legislative wave of bills aims to fill regulatory gaps, tackle emerging hazards, expand OSHA authority, and raise penalties. Topics addressed by these bills include musculoskeletal disorders, heat stress, infectious diseases, wildfire smoke, and workplace violence.
In a recently issued letter of interpretation, OSHA states that a burn injury caused by a personal lithium-ion battery fire is work related if it occurs in the workplace during assigned working hours. The letter details an incident where an employee was burned when their rechargeable lithium-ion batteries for e-cigarettes sparked a fire after coming into contact with a key used for work.
A new report from the Department of Labor Office of Inspector General concludes that OSHA struggles to meet its mission, particularly in high-risk industries like healthcare, construction, and manufacturing. Several pages point to OSHA’s difficulties in effectively enforcing annual injury and illness reporting requirements, reaching the nation’s high-risk worksites for inspection, and addressing workplace violence by regulatory or other action.
Turning to environmental news, EPA extended the deadlines for Facility Evaluation Reports and related requirements for coal combustion residuals facilities. In most instances, the deadlines have been moved one or two years out.
And finally, EPA announced a final rule eliminating the 2009 Endangerment Finding and related greenhouse gas emission requirements for on-highway vehicles and vehicle engines. When the final rule takes effect, manufacturers and importers of new motor vehicles and motor vehicle engines will no longer have to measure, report, certify, or comply with federal greenhouse gas emission standards.
Thanks for tuning in to the monthly news roundup. We’ll see you next month!
NewsAir EmissionsChange NoticesChange NoticeColoradoCAA ComplianceEnvironmentalFocus AreaEnglishAir ProgramsAir Programs
2026-03-06T06:00:00Z
Colorado adds landfill methane emission regulation
Effective date: February 14, 2026
This applies to: Open and closed municipal solid waste landfills
Description of change: The Colorado Air Quality Control Commission added Regulation 31, which establishes new emission control and monitoring requirements for municipal solid waste landfills. Applicability is based on the landfill’s amount of waste it holds and methane emissions.
Significant changes implemented by Regulation 31 include:
- Establishing a stricter emission control threshold than federal standards so that more landfills must install gas collection and control systems,
- Mandating closed landfills with emission combustion devices to install biofilters when the devices are removed,
- Expanding the methane monitoring requirements (allowing additional monitoring tools for identifying large emission sources) and allowing alternative monitoring technologies for periodic monitoring, and
- Phasing in a ban on open flares to replace them with enclosed flares.
Related state info: Clean air operating permits state comparison
New Network Poll

Navigating marijuana, alcohol, and substance misuse
Apr 24, 2026
A federal proposal to reclassify marijuana as a less risky drug adds another wrinkle to an already complicated issue. Safety, productivity, and employee well-being are all jeopardized by drug abuse and misuse. Don’t wait to take action; A proactive approach can deter employee drug use and support safe work sites.
This webcast will address:
- Marijuana reclassification
- Preventing problems
- What employees and supervisors need to know
- Drug testing and state laws
- ADA requirements
The webcast will conclude with a Q&A session, so bring your questions!
Event Presenters
Related Content
Federal government revives medical marijuana proposal
Marijuana on the move: Be ready to review workplace policies

No active poll
Please come back soon!
Most Popular Highlights In Environmental
NewsClosuresIndustry NewsIndustry NewsWaste/HazWasteWasteEnvironmental Protection Agency (EPA)Waste ManagementEnvironmentalSolid WasteEnglishFocus AreaUSA
2026-04-16T05:00:00Z
EPA proposes major changes to coal combustion residuals rules
The Environmental Protection Agency (EPA) published a proposed rule on April 13, 2026, to revise the existing regulations governing the disposal of coal combustion residuals (CCR) in landfills and surface impoundments as well as the beneficial use of CCR.
Who’s impacted?
The proposed rule affects coal-fired electric utilities and independent power producers subject to the CCR disposal and beneficial use regulations at 40 CFR Part 257.
What are the changes?
Significant changes the EPA proposes include:
- Adding an option for facilities to certify the closure of legacy CCR surface impoundments by CCR removal that were closed before November 8, 2024, under regulatory oversight;
- Expanding the eligibility criteria for facilities to defer CCR closure requirements until site-specific determinations are made for legacy surface impoundments that were closed before November 8, 2024, under regulatory oversight;
- Exempting CCR dewatering structures (used to dewater CCR waste for the disposal of CCR elsewhere) from federal CCR regulations (Part 257);
- Rescinding all CCR management unit (CCRMU) requirements or revising the existing CCRMU regulations;
- Allowing permit authorities to make site-specific determinations regarding certain requirements during permitting for CCR units complying with federal CCR groundwater monitoring, corrective action, and closure requirements under a federal or an approved-state CCR permit; and
- Revising the beneficial use requirements by:
- Removing the environmental demonstration requirement for non-roadway use of more than 12,400 tons of unencapsulated CCR; and
- Excluding these beneficial uses from federal CCR regulations (Part 257):
- CCR used in cement manufacturing at cement kilns,
- Flue gas desulfurization (FGD) gypsum used in agriculture, and
- FGD gypsum used in wallboard.
Key to remember: EPA plans to make significant amendments to the coal combustion residuals requirements.
NewsHazardous WasteIndustry NewsEnglishWaste ManifestsSafety & HealthGeneral Industry SafetyWasteEnvironmentalIn-Depth ArticleEnvironmental Management SystemsFocus AreaUSA
2026-04-14T05:00:00Z
What to know about EPA’s proposed manifest sunset rule
The Environmental Protection Agency (EPA) is taking another major step toward modernizing hazardous waste tracking. The agency’s proposed “manifest sunset rule” would officially phase out paper hazardous waste manifests and require the exclusive use of the e-Manifest system. For employers, especially those generating or managing hazardous waste, it’s a fundamental shift in how waste shipments are documented, tracked, and audited.
Since 2018, EPA’s e-Manifest system has been available as a digital alternative to paper manifests. Over the years, the agency has added requirements pushing the industry toward adoption, including mandatory registration and electronic data submission. But despite those efforts, many companies have continued to rely on paper manifests, either out of habit, for convenience, or because parts of their waste chain weren’t ready to go digital. EPA even states in the proposed rule that fewer than 1 percent of all e-Manifest users have completely switched to digital manifests. The proposed sunset rule is designed to close that gap. Once finalized, it would set a firm deadline (24 months) after which paper manifests would no longer be allowed.
Why EPA wants to eliminate paper manifests
EPA’s reasoning is pretty straightforward. Paper manifests are slower, easier to lose, and more prone to errors. They rely on manual handling and delayed processing, which can create gaps in tracking and compliance. A fully electronic system, on the other hand, allows for real-time visibility, standardized data entry, and faster correction of mistakes. It also gives regulators a clearer, more immediate picture of what’s happening across the entire waste life cycle.
Addressing one of the biggest digital barriers: signatures
One overlooked part of the proposed rule is how EPA is trying to solve one of the biggest barriers to going fully digital, which is signatures in the field. Anyone who has dealt with manifests knows that the weak point is often the hand-off between the generator and the transporter, especially when drivers don’t have system access or reliable connectivity.
To address that, EPA is proposing new functionality that would allow users to sign manifests using quick response (QR) codes or even short message service (SMS). In practice, this could mean a driver scans a QR code or receives a text prompt and then completes the signature process directly on the phone. So, no login or full system access is needed. EPA is also exploring the ability to use SMS and QR-based tools to make updates to manifest data without needing full system permissions. That’s a big deal operationally because it removes one of the most common bottlenecks in needing a registered user at a specific site to make even minor corrections.
Operational challenges companies should expect
With that said, moving to a fully digital system still comes with potential issues. It requires coordination across your entire operation. Generators, transporters, and disposal facilities all have to be aligned and capable of using the system effectively. If one party in that chain struggles, it can create delays or compliance issues for everyone involved. There’s also an upfront investment to consider. Companies may need to upgrade internal systems, ensure reliable connectivity, and train employees in new work processes. For organizations with multiple sites or field operations, this can take some planning. But over time, many of those burdens are expected to decrease. Electronic signatures, reusable templates, and centralized recordkeeping can significantly reduce administrative work.
One of the biggest shifts employers will notice is the level of visibility. With paper manifests, there’s often a lag between shipment and final documentation. In a digital system, that lag disappears. Information becomes available almost immediately, and regulators have access to the same data. That means errors or discrepancies are easier to find and harder to ignore.
The good news is that companies don’t have to wait for the final rule to start preparing. Taking a close look at your current manifest process is a good first step. If paper is still a major part of your workflow, that’s a clear signal that changes are coming. Making sure your e-Manifest account is fully set up and that employees understand how to use it will go a long way in avoiding future disruptions.
Keys to remember: The EPA’s proposed Paper Manifest Sunset Rule would set a firm date to phase out paper hazardous waste manifests and require that all covered shipments be tracked through the agency’s electronic e‑Manifest system, through which the Agency says will improve hazardous waste tracking and transparency while reducing administrative burden and saving regulated entities roughly $28.5 million per year.
NewsGreenhouse GasesIndustry NewsIndustry NewsAir ProgramsEnvironmental Protection Agency (EPA)CAA ComplianceEnvironmentalFocus AreaEnglishVolatile Organic CompoundsAir ProgramsStationary Emission SourcesUSA
2026-04-10T05:00:00Z
EPA amends specific oil and gas emission standards
On April 9, 2026, the Environmental Protection Agency (EPA) published a final rule that makes technical changes to the emission standards established in March 2024 (2024 Final Rule) for crude oil and natural gas facilities. This rule (2026 Final Rule) amends the requirements for:
- Temporary flaring of associated gas, and
- Vent gas net heating value (NHV) monitoring provisions for flares and enclosed combustion devices (ECDs).
Who’s impacted?
The 2026 Final Rule affects new and existing oil and gas facilities. Specifically, it applies to the regulations for the Crude Oil and Natural Gas source category, including the:
- New Source Performance Standards at 40 CFR 60 Subpart OOOOb, and
- Emission guidelines at 60 Subpart OOOOc.
These emission standards are commonly referred to as OOOOb/c.
What are the changes?
The 2026 Final Rule implements technical changes to the temporary flaring and vent gas NHV monitoring requirements set by the 2024 Final Rule.
Temporary flaring
The rule extends the baseline time limit for temporary flaring of associated gas at well sites in certain situations (like conducting repairs or maintenance) from 24 to 72 hours. Owners and operators must stop temporary flaring as soon as the situation is resolved or the temporary flaring limit is reached (whichever happens first).
It also grants allowances beyond the 72-hour limit if exigent circumstances occur (such as severe weather that prevents safe access to a well site to address an emergency or maintenance issue) and there’s a need to extend duration for repairs, maintenance, or safety issues. Owners and operators must keep records of exigent circumstances and include the information in their annual reports.
NHV monitoring
For new and existing sources, the 2026 Final Rule exempts all flare types (unassisted and assisted) and ECDs from monitoring due to high NHV content, except when inert gases are added to the process streams or for other scenarios that decrease the NHV content of the inlet stream gas. In these cases, EPA requires NHV monitoring via continuous monitoring or the alternative performance test (sampling demonstration) option for all flares and ECDs.
Other significant changes include:
- Replacing the general exemption from NHV monitoring for associated gas for any control device used at well site affected facilities with NHV monitoring requirements,
- Granting operational pauses during weekends and holidays for the consecutive 14-day sampling demonstration requirements (limiting it to no more than 3 operating days from the previous sampling day), and
- Permitting less than 1-hour sampling times for twice daily samples where low or intermittent flow makes it infeasible (as long as owners and operators report the sampling time used and the reason for the reduced time).
The 2026 Final Rule takes effect on June 8, 2026.
Key to remember: EPA’s technical changes to the emission standards for oil and gas facilities apply to temporary flaring provisions and vent gas NHV monitoring requirements.
NewsAir QualityIndustry NewsIndustry NewsAir ProgramsEnvironmental Protection Agency (EPA)Hazardous Air PollutantsCAA ComplianceEnvironmentalFocus AreaEnglishAir ProgramsStationary Emission SourcesUSA
2026-04-02T05:00:00Z
EPA releases final NESHAP for chemical manufacturing area sources
The Environmental Protection Agency (EPA) published a final rule on April 1, 2026, amending the National Emission Standards for Hazardous Air Pollutants (NESHAP) for Chemical Manufacturing Area Sources (CMAS). The NESHAP controls hazardous air pollutant (HAP) emissions from facilities that manufacture a range of chemicals and products, such as inorganic chemicals, plastics, and synthetic rubber.
Who’s impacted?
The final rule applies to nine area source categories in the chemical manufacturing sector that are regulated by the CMAS NESHAP (40 CFR 63 Subpart VVVVVV).
What are the changes?
EPA’s final rule:
- Establishes leak detection and repair requirements for equipment leaks and heat exchange systems in organic HAP service,
- Adds detectable emissions monitoring standards for pressure vessels in organic HAP service and emission management practice standards for pressure relief devices (PRDs) in organic HAP service,
- Prohibits closed vent systems in organic HAP service from bypassing an air pollution control device (APCD), and
- Requires recurring performance testing of non-flare APCDs to demonstrate compliance with process vent and storage tank provisions.
The final rule also mandates electronic reporting for notifications of compliance status (NOCs), performance test reports, and periodic reports. Facilities must submit these reports through the Compliance and Emissions Data Reporting Interface (CEDRI) on EPA’s Central Data Exchange.
What didn’t change?
Significantly, the final rule doesn’t add previously proposed regulations for area sources that use ethylene oxide (EtO) to produce materials described by code 325 of the North American Industry Classification System (NAICS).
EPA states that it intends to address the regulation of EtO from area sources and major sources in one final action.
What are the compliance timelines?
Existing facilities must comply with the amendments by April 1, 2029.
New facilities (those that begin construction or reconstruction after January 22, 2025) have to comply with the changes by April 1, 2026, or upon startup, whichever is later.
Additionally, facilities must start electronically submitting:
- Performance tests by June 1, 2026;
- NOCs by August 31, 2026; and
- Periodic reports by April 1, 2029.
Key to remember: EPA’s final HAP emissions rule for chemical manufacturing area sources adds new requirements for certain processing equipment and systems.
NewsIndustry NewsCAA ComplianceEnvironmentalIn-Depth ArticleFocus AreaEnglishAir PermittingAir ProgramsUSA
2026-04-13T05:00:00Z
How incinerators are permitted: A look at the regulatory framework and EPA’s new streamlining proposal
Incinerators in the United States operate under a complex permitting framework designed to protect air quality, public health, and the environment. Under the Clean Air Act (CAA), facilities that burn waste must meet strict emission standards, maintain operating controls, and follow extensive monitoring and reporting rules. These requirements ensure that incineration, while a valuable tool for waste management, wildfire mitigation, and disaster recovery, remains safe and consistent with federal air quality objectives. Against this backdrop, the Environmental Protection Agency (EPA) recently proposed a rule to streamline permitting for specific types of incinerators used in wildfire prevention and disaster cleanup, a move that could reduce delays for state and local governments.
The regulatory basis for incinerator permitting
Most incinerators fall under Section 129 of the CAA, which mandates EPA to establish performance standards and emission guidelines for categories of solid waste combustion units. These standards govern pollutants such as particulate matter, carbon monoxide, sulfur dioxide, nitrogen oxides, lead, cadmium, mercury, hydrogen chloride, and dioxins/furans. Operators must also conduct emissions testing, maintain continuous monitoring equipment, track operational parameters, and submit regular compliance reports.
Permitting generally occurs through Title V operating permits, which consolidate all applicable air quality requirements into a single enforceable document. A Title V permit typically requires annual certifications, detailed recordkeeping, periodic emissions tests, and reporting of deviations. While the Title V program doesn't impose new standards, it ensures that incinerators comply with all existing federal and state air quality rules.
Different categories of incinerators, such as large municipal waste combustors (LMWC), small municipal waste combustors (SMWC), commercial and industrial solid waste incinerators (CISWI), and other solid waste incinerators (OSWI), have distinct requirements. These subcategories reflect variations in unit size, waste composition, and operational design, and each has its own subpart under EPA’s air quality regulations.
Air curtain incinerators: A special case
Air curtain incinerators (ACIs), which burn wood waste, yard debris, and clean lumber, occupy a niche segment of the permitting landscape. They use a mechanized “curtain” of air to increase combustion efficiency and reduce particulate emissions compared to open burning. However, their regulatory treatment has historically been inconsistent.
Because ACIs fit partly within several existing subparts, operators often face confusion about which monitoring, opacity limits, and reporting duties apply. Overlap across four regulatory categories can create delays, particularly during emergencies when ACIs are deployed to remove vegetative fuels that increase wildfire risk or to process debris after storms.
EPA’s emergent focus on streamlining
In March 2026, EPA announced a proposal to consolidate the regulatory requirements for ACIs used solely to burn wood-derived materials into a single subpart under Section 129 of the CAA. The proposal would also allow these ACIs to operate without a Title V permit unless located at a facility that otherwise requires one.
EPA stated that the change would “cut red tape” and provide clarity for state, local, and Tribal governments, allowing them to respond more effectively to natural disasters and conduct wildfire mitigation activities without unnecessary administrative delays. The agency emphasized that unprocessed debris contributes to poor air and water quality and poses safety risks, particularly in post disaster environments.
Context: Broader federal actions on disaster-related incineration
The proposal follows earlier federal steps to ease the temporary use of incinerators during emergencies. In 2025, EPA issued an interim final rule permitting CISWI units to burn nonhazardous disaster debris for up to 8 weeks without prior EPA approval, a provision intended to accelerate cleanup after hurricanes, wildfires, and floods. These units must still operate their pollution control equipment, and extensions beyond 8 weeks require EPA authorization.
Such measures reflect the increasing volume of debris associated with severe weather events and the need for rapid, environmentally sound disposal mechanisms. The current proposal for ACIs builds on these efforts by targeting the specific regulatory bottlenecks associated with vegetative and wood waste disposal.
Looking ahead
EPA’s streamlined permitting proposal doesn't alter emission standards but rather clarifies and simplifies administrative pathways. If finalized, it may make ACIs more accessible during periods of heightened wildfire risk and in the critical early stages of disaster recovery.
Key to remember: At its core, the permitting system for incinerators aims to balance environmental protection with operational flexibility. The new proposal underscores EPA’s recognition that, in emergency contexts, speed matters but so does environmental stewardship.
NewsWaste/HazWasteUniversal WasteChange NoticesChange NoticeWasteEnvironmentalEnglishLouisianaFocus Area
2025-12-02T06:00:00Z
Louisiana adds aerosol cans to universal waste program
Effective date: November 20, 2025
This applies to: Owners and operators of all facilities that generate, transport, treat, store, or dispose of hazardous waste
Description of change: The Louisiana Department of Environmental Quality added hazardous waste aerosol cans to the universal waste program. The program streamlines hazardous waste management requirements and is identical to the federal universal waste requirements for aerosol cans.
View related state info: Universal waste — Louisiana
Most Popular Highlights In Transportation

NewsIndustry NewsFood transportationFood transportationFocus AreaIn-Depth ArticleFleet OperationsEnglishTransportationUSA
2026-04-22T05:00:00Z
From shipping dock to destination: A refresher on the food transportation rule
Food safety doesn’t stop at the loading dock — and neither does accountability. Keeping food safe for consumption requires every party in the supply chain to do their job.
The Sanitary Transportation of Human and Animal Food (STHAF) rule sets clear expectations. The rule lays out practical requirements designed to prevent contamination, temperature abuse, and unsafe food from ever reaching consumers.
The rule overview
The STHAF rule is found in 21 Code of Federal Regulations Part 1 and applies to vehicles, transportation equipment, operations, training, and records involved in food transportation.
STHAF high-level requirements include:
• Vehicles and equipment used to haul food must be suitable, sanitary, and cleanable.
• Equipment must be always kept clean and sanitary.
• Trailers, totes, tanks, pallets, hoses, and pumps must be designed and maintained to prevent contamination.
• For temperature - controlled foods, equipment must maintain required temperatures throughout transport.
• Vehicles must be maintained to prevent pest harborage (e.g., rodents, insects), and contamination from damage (e.g., exposed insulation).
Shipper responsibilities
Shippers have the ultimate responsibility for the sanitary transportation of their food but may assign duties to carriers through written agreements. This means that carriers should be prepared to follow shipper requirements for:
• Cleaning and sanitation,
• Temperature control and reporting in-transit, and
• Inspection procedures at origin and destination.
Carriers may also be delegated responsibility for ensuring:
• Vehicles meet shipper specifications;
• Required cleaning and sanitizing is done;
• Vehicles are properly precooled before loading;
• Food segregation from raw food or non-food items;
• Temperature is monitored and documented during transit; and
• Proof of prior cargo and most recent cleaning is provided for bulk vehicles, if requested.
Loader and receiver responsibilities
Loading and receiving facilities have a responsibility for maintaining temperature-sensitive food safety, as well.
Loaders must:
• Inspect vehicles, trailers, and containers for sanitary conditions, and
• Verify trailers are adequately precooled.
Receiver must:
• Check for in‑transit temperature abuse,
• Verify food and vehicle temperatures, and
• Inspect for unusual odors.
Carrier policies and procedures
The rule doesn’t prescribe how cleanliness and sanitary conditions must be maintained. That depends on carrier policies and procedures along with following express requirements set forth in shipper contracts.
Basic carrier policies and procedures should cover areas, such as:
- A mandate to repair interior damage immediately;
- Prohibitions against using wooden floors and walls due to sanitation and splinters, as well as using contaminated dunnage;
- Trailer and container sanitation procedures after every haul;
- The proper separation to prevent cross-contamination;
- Precooling and temperature monitoring and reporting;
- No reuse of contaminated packaging or securement material (dunnage);
- Good hygiene by loaders and drivers, like clean clothing, handwashing, or beard nets (if required).
Training and recordkeeping
Unless assigned to the carrier by agreement, shippers must ensure drivers are trained at-hire and on a recurring basis on the following topics:
• Awareness of food safety risks during transport,
• Sanitary transportation practices, and
• Applicable food safety regulations.
Carriers must maintain records for:
• Written agreements with shippers,
• Required procedures, and
• Driver training.
Record retention guidance:
• Keep records while effective, plus 12 months;
• Records may be electronic or paper;
• Must be available within 24 hours upon request; and
• Cleaning and inspection procedures must be available onsite.
Notification of unsafe food
If a failure (e.g., temperature deviation or contamination) renders food unsafe:
• The party responsible must notify all others involved, and
• The food cannot be sold or distributed.
The only exception is if a qualified individual determines the food is still safe for consumers.
Keys to remember: Shipper, receiver and carrier adherence to sanitation procedures, is key to keeping food safe for consumption. The STHAF rule makes food safety a shared responsibility every mile of the trip.
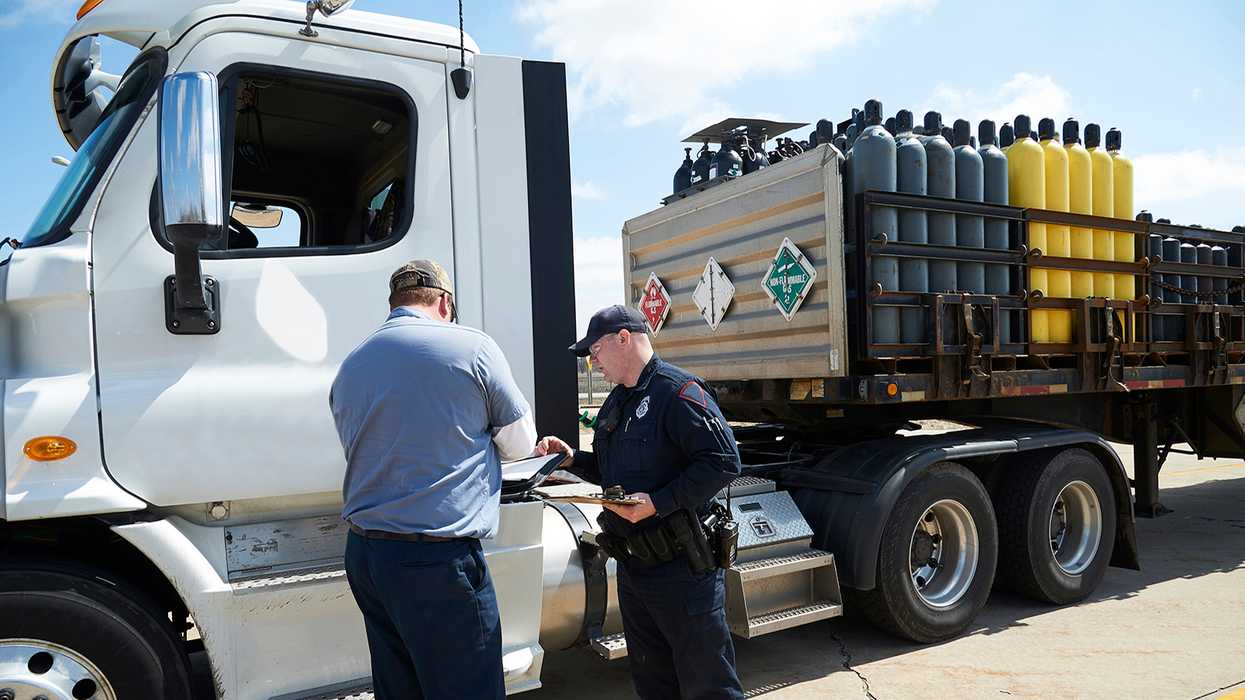
NewsIndustry NewsFleet SafetyDrug and Alcohol Testing - DOTFocus AreaIn-Depth ArticleUSAEnglishTransportationDrug and Alcohol Clearinghouse - Motor Carrier
2026-04-22T05:00:00Z
Setting the Clearinghouse record straight for DUIs in CMVs
It’s not the news any employer wants to hear. One of your drivers was charged with driving under the influence (DUI) while operating a vehicle requiring a commercial driver’s license (CDL). What’s next? Can the driver fight it? What if they get it tossed out in court?
Motor carrier responsibilities
Under DOT drug and alcohol testing rules, “actual knowledge” occurs when an employer learns of drug or alcohol use based on specific scenarios, including a traffic citation for DUI in a CDL commercial motor vehicle (CMV). A traffic citation includes a ticket, complaint, or other document charging a driver.
An employer’s actual knowledge of a Part 382 violation is treated the same as any other drug or alcohol violation (e.g., failed test, refusal to test). The motor carrier must:
- Pull the driver from all safety-sensitive functions (SSFs),
- Provide the driver with a list of substance abuse professionals, and
- Report the actual knowledge to the Drug and Alcohol Clearinghouse.
The driver’s Clearinghouse status is changed to Prohibited at this point.
Even if the driver wants to fight the charges in court, the driver can’t resume SSFs. Instead, the driver must complete the return-to-duty (RTD) process, get the citation dismissed, or be adjudicated not guilty.
Drivers who are convicted of DUI in a CDL CMV must comply with the RTD requirements and follow-up testing.
DUIs that result in ‘non-convictions’
Suppose your driver wins in court. The Federal Motor Carrier Safety Administration (FMCSA) won’t enforce the RTD process for the DUI when the citation results in a non-conviction.
The term “non-conviction” means that the charge of DUI in a CMV is dismissed without the imposition of fines, court costs, or other punitive actions, or there is an unvacated adjudicated finding of not guilty. Terms that states may use to indicate a dismissal include:
- Nolle Prosequi (Nolle Pros’d or Nolle Prossed),
- Withdrawn, or
- Discontinued.
The term “non-conviction” does not include pleading guilty to a lesser charge (e.g., reckless driving).
Petitioning FMCSA
Does FMCSA automatically update the driver’s record following a non-conviction? No, the court system doesn’t notify FMCSA of the case’s final disposition. The driver must notify FMCSA of the non-conviction by submitting a petition along with documentation. Documentation may include:
- A certificate of disposition from the court,
- A letter from a prosecutor stating that the charge has been dropped, or
- A screenshot from a court online docket system that displays the disposition.
A statement from the driver, even if provided in the form of an affidavit, will not be considered unless accompanied by documentary evidence.
The driver may resume safety-sensitive functions when FMCSA accepts the evidence and changes the Clearinghouse status from Prohibited to Not Prohibited.
The driver whose charges resulted in a non-conviction is no longer required to pursue the RTD program and follow-up testing.
Key to remember: An employer who learns of a DUI in a CDL CMV must report it as actual knowledge, even if the driver plans on challenging it in court. The driver can’t return to SSFs unless there is proof of a non-conviction or successful completion of the RTD process.

NewsIndustry NewsFleet SafetyRisk Management TransportationRisk Management - Motor CarrierFocus AreaIn-Depth ArticleEnglishTransportationUSA
2026-04-09T05:00:00Z
Are your drivers and spotters speaking the same language?
Maneuvering a commercial truck and trailer into a tight spot or through a busy area in a yard is no easy feat. A common best practice is to use spotters to help drivers safely navigate through these obstacles.
Even with this additional set of eyes and ears, drivers must remain alert and effectively communicate with the spotter.
Common, basic hand signals
To help avoid hazards, a spotter directs the commercial driver using hand signals to make a desired vehicle movement. To be effective and safe, the spotter and driver must speak the same language.
Unlike some industries such as construction, the hand signals used throughout the trucking industry are not standardized. Drivers and yard employees should be trained on common, basic hand signals.
When at a shipper or receiver’s facility, the driver obviously has less control over the situation. The company’s standardized hand signals may not be recognized. The driver needs to discuss agreed upon hand signals with the yard or warehouse employee who is directing the driver.
The more commonly used hand signals that should be standardized include:
- Pull forward to the left
- Pull forward to the right
- Back up
- Back up — driver’s side
- Back up — passenger’s side
- Distance to travel
- Stop
- Slow down
- Emergency stop
Above all, the stop signal needs to be clearly understood. It could make the difference between a safe docking and a crushed worker. Variations include both arms crossed with hands in fists, or hands straight up. In any event, the driver and spotter must agree on the stop signal, reinforced by yelling loudly to stop.
Driver’s safety measures
A driver should assess their surroundings before backing up and following a spotter’s directions:
- Walk around the commercial vehicle, making sure nothing is in the path of the tires;
- Observe people in the area;
- Check for obstructions in the cab that would block the line of sight of the mirrors; and
- Verify the position of the spotter (i.e., back of the trailer using the passenger-side mirror).
The driver must stop the vehicle immediately when:
- Unsure of the spotter’s signals. They must clarify the meaning before proceeding.
- Their attention is drawn away from the spotter (including looking away from the mirrors). They should continue only after confirming the last signal.
Spotter’s role
Spotters have their own safety concerns. They must be alert to:
- The position of the trucks, and
- Other hazards approaching or in the truck or trailer’s path.
To ensure their own personal safety, they should:
- Wear bright clothing or a vest,
- Be visible in the driver’s passenger mirror,
- Avoid walking backward while giving instructions to the driver,
- Assume a position that’s a safe distance from the truck,
- Make sure nothing will be in their walking path, and
- Keep eye contact with the driver at all times.
To make sure the driver knows where the spotter is at all times, they may need to change positions frequently so that they are visible in the driver’s passenger mirror.
Key to remember: A driver and spotter must effectively communicate to ensure the safety of the truck, spotter, and bystanders in busy yards and loading docks.
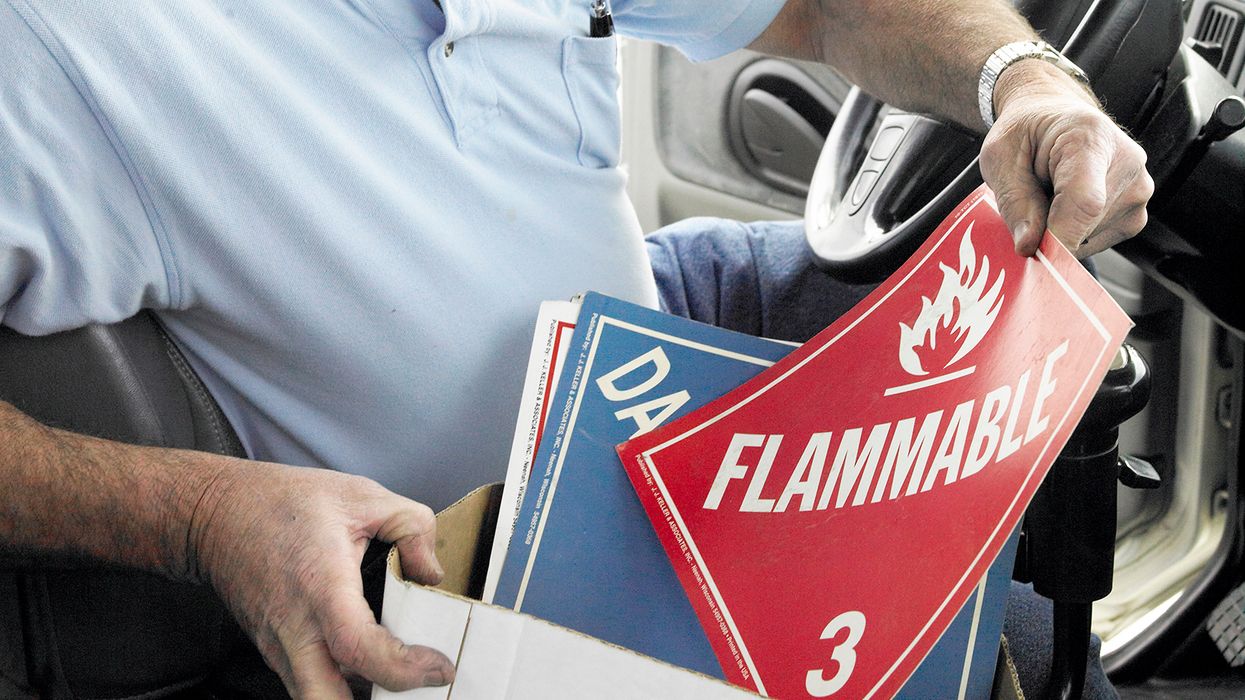
NewsIndustry NewsHazmat markingsTransportationHazmat SafetyIn-Depth ArticleHazmat markings, Placards, and LabelsEnglishFocus AreaUSA
2026-04-21T05:00:00Z
Details that can trip up a hazmat shipment
Hazmat shipments rarely fail because of one big, dramatic mistake. They normally go wrong because of small details that slip through the cracks, like paperwork that isn’t quite right or labels that don’t match the shipment. These foundational issues continue to be the most common reasons shipments get delayed, rejected, or fined during inspections.
That’s what makes them so frustrating. These aren’t advanced compliance challenges. They’re the basics, and yet they still trip people up in real-world operations where speed, volume, and changing requirements all collide.
Where documentation breaks down
Shipping papers are one of the most frequent sources of trouble. They’re essential, but they’re also complex, repetitive, and easy to get slightly wrong. A missing piece of information, an outdated description, or a mode-specific requirement that isn’t accounted for can quickly turn into a compliance issue.
Problems usually happen when something changes. A shipment moves from ground to air, an international leg is added, or a different carrier gets involved. Each change brings new requirements, and if paperwork isn’t rechecked carefully it can fall out of compliance fast.
Time pressure plays a role, too. When employees are focused on keeping freight moving, documentation can become a routine task instead of a true verification step. Small details like emergency response information or proper descriptions can be overlooked, even by experienced staff.
Labeling and placarding are familiar, but still vulnerable
Marking, labeling, and placarding issues are just as common. Missing labels, incorrect hazard classes, outdated markings, or placards that don’t match the paperwork continue to appear during inspections.
These errors often happen late in the process. Quantities change, packaging is adjusted, or materials are substituted, but labels and placards don’t always get updated to reflect those changes. When things look similar to past shipments, it’s easy to assume the markings are still correct without rechecking them.
Most of the time, this isn’t about a lack of knowledge. It’s about execution under pressure. Employees know labels and placards matter, but they still have to be current for that specific shipment, every time.
Simple checks that catch the problems early
Preventing these issues usually doesn’t require complicated processes or extra approvals. It comes down to building simple verification steps into daily workflows.
A second set of eyes on shipping papers can quickly catch missing or mismatched information. Taking a brief pause to confirm that labels and placards match the documentation usually prevents much bigger problems later. Short, consistent checks are far more effective than long, infrequent reviews.
Technology can help reinforce those checks as well. Shipping software and digital documentation tools can flag missing fields or inconsistencies before paperwork is finalized. When systems support decisions at the moment they’re made, accuracy improves and stress goes down.
Getting the basics right every time
When hazmat shipments go wrong, it’s usually because the basics didn’t line up. Documentation, labels, and placards all have to tell the same story. When one piece is off, everything else is at risk.
Hazmat shipping is inherently complex, but getting the fundamentals right doesn’t require perfection. It requires consistent attention to the details that matter most. When teams slow down just enough to verify the basics before a shipment moves, errors drop, inspections go more smoothly, and confidence goes up.
Key to remember: Most hazmat shipment issues come from small execution errors, not complex rules. Taking time to recheck paperwork and ensure labels and placards match the shipment can prevent most compliance issues.

NewsDriver qualification and hiringReasonable suspicion drug and alcohol testing - Motor CarrierRecruiting and hiringSafety & HealthFocus AreaAssociate RelationsTransportationDisabilities and ADAReasonable AccommodationsDrug and Alcohol TestingDrug and Alcohol TestingDisabilities and ADAMarijuanaHuman ResourcesUSADrug and Alcohol Testing - DOTDriver qualificationsDrug testing - Motor CarrierDrug and alcohol training - Motor CarrierHiring standards - Motor CarrierHR ManagementEnglishDriver recruiting and retentionTalent Management & RecruitingIndustry NewsIndustry NewsFleet SafetyGeneral Industry SafetyDrivers qualification (DQ file)HR GeneralistApplications/Applicants
2026-04-23T05:00:00Z
Federal government reschedules medical marijuana
Medical marijuana has been reclassified into a lower drug category, placing it into the same classification as some prescription painkillers.
Attorney General Todd Blanche issued an order on April 23 moving medical marijuana from Schedule I of the Controlled Substances Act to Schedule III, a class of drugs with a moderate to low potential for dependence, that includes ketamine, Tylenol with codeine, and anabolic steroids. Schedule III drugs can be obtained with a prescription.
Under the order, products containing marijuana approved by the Food and Drug Administration (FDA) and marijuana products regulated by a state medical marijuana law are now in the lower drug category.
Rescheduling the drug into a lower classification will support research into marijuana safety and use of the drug for medical purposes, the attorney general noted in a press release.
Impact on the workplace
The order doesn’t address how the rescheduling of medical marijuana impacts compliance with other federal laws, but to avoid the risk of a discrimination claim under the federal Americans with Disabilities Act, employers in states where medical marijuana is legal should treat individuals using medical marijuana as they would treat any individual using a prescription medication.
This includes having a discussion with the employee about accommodations, which may include off-duty use of medical marijuana.
In states where medical marijuana isn’t legal, employers would only need to consider accommodations for use of marijuana products approved by the FDA.
Recreational marijuana considerations
The order doesn’t legalize recreational marijuana, but does announce a June 29 hearing to evaluate broader changes to marijuana’s status under federal law.
The order notes that it doesn’t apply to synthetically derived THC, such as Delta-10 products. The final order notes that synthetically derived THC is outside of the definition of marijuana.
The order also establishes a federal licensing system for state medical marijuana manufacturers and dispensaries. It notes that states where medical marijuana is legal have established systems to regulate the sale and use of medical marijuana.
How does this affect safety-sensitive jobs?
The Drug Enforcement Administration’s reclassification order doesn’t address the impact the change would have on federal drug testing regulations. Specifically, it doesn’t offer insights into Department of Transportation (DOT) drug testing of truck drivers, airline pilots, pipeline operators, and others in safety-sensitive positions.
Before any changes can be implemented by the DOT, drug testing procedures in 49 CFR Part 40 must go through the rulemaking process.
Key to remember: The federal government has moved medical marijuana to a lower classification of drug. To reduce the risk of a discrimination claim, employers in states where medical marijuana is legal should treat it as a prescription medication to lower the risk of a discrimination claim. Employers in all states should consider accommodations for FDA-approved marijuana products.

NewsIndustry NewsIndustry NewsEnglishFocus AreaFleet OperationsEnforcement - DOTRoadside InspectionsTransportationUSA
2026-04-16T05:00:00Z
FMCSA updates the DataQs data-correction system
The Federal Motor Carrier Safety Administration (FMCSA) has announced updates to its DataQs program to improve turnaround times for drivers and motor carriers awaiting corrections to their safety records.
States will need to meet strict deadlines and follow a three-step independent review process when handling requests to fix data on crashes, inspections, and violations.
DataQs background
DataQs is an online system that allows motor carriers, drivers, and other industry personnel to view and track FMCSA crash and inspection data. Interested parties use the system — available at dataqs.fmcsa.dot.gov — to submit a “Request for Data Review” (RDR) when they believe data may be incomplete or incorrect. In 2024, DataQs processed more than 71,000 requests, including at least 8,300 related to crash data. The FMCSA says the revisions announced April 15, 2026, will establish a more streamlined framework for handling RDRs, specifically for states receiving Motor Carrier Safety Assistance Program (MCSAP) funding from FMCSA. The states will need to:
- Designate points of contact for crash and inspection RDRs.
- Review requests submitted within three years of an inspection and within five years of a crash.
- Include detailed explanations of their decisions, including evidence reviewed and next steps in the review process, for all decisions, especially those where no data correction is made.
- Participate in FMCSA program reviews and follow established policies, including those related to adjudicated citations.
Three-stage review
States will also need to implement a multi-stage, independent review structure that includes:
- Initial review within 21 days to ensure decisions are not made solely by the issuing officer when denying a correction;
- Reconsideration within 21 days. conducted by independent subject matter experts not involved in the initial decision; and
- Final review completed within 45 days by a senior decision-maker or independent panel, helping to remove bias from the determination.
The FMCSA is requiring states to submit DataQs Implementation Plans detailing how they will meet the new requirements, address backlogs, and prevent future delays. The approved plans will be publicly available through the DataQs system.
States will need to begin submitting draft plans in June 2026 and implement them before the end of September.
Find more information at https://roar-assets-auto.rbl.ms/documents/108770/2026-07429.pdf
Most Popular Highlights In Human Resources
NewsIndustry NewsCompensationPayrollCompensationHR GeneralistFamily and Medical Leave Act (FMLA)In-Depth ArticleFamily and Medical Leave Act (FMLA)Associate RelationsEnglishUSAHR ManagementFocus AreaHuman Resources
2026-04-16T05:00:00Z
May employers transfer employees on intermittent leave?
When employees take intermittent leave under the federal Family and Medical Leave Act (FMLA), employers might want to move them into a different position that better suits the needs of the business. Employers must, however, tread carefully, because they may make such transfers or reassignments only in limited circumstances.
Foreseeable leave only
Employers may require employees on intermittent or reduced schedule leave only if the leave is foreseeable based on planned medical treatment for the employee, a family member, or a covered servicemember, including during a period of recovery from:
- The employee’s own serious health condition;
- A serious health condition of a spouse, parent, or child; or
- A serious injury or illness of a covered servicemember.
Employers may also require employees to transfer to an alternative position in cases of intermittent or reduced-schedule leave for bonding with a healthy child.
Unforeseeable intermittent leave might cause the majority of the headaches, but employers may not permanently transfer employees who take this type of leave.
Instead, in these situations, employers may require an employee to transfer temporarily, while the employee needs leave, to an available alternative position for which the employee is qualified and which better accommodates recurring periods of leave than does the employee's regular position.
Alternative positions
In situations when employers may transfer employees to an alternative position, the position must have equivalent pay and benefits, but it doesn’t have to have equivalent duties.
Employers may increase the pay and benefits of an existing alternative position to make them equivalent to the pay and benefits of the employee's regular job.
Employers may also transfer the employee to a part-time job with the same hourly rate of pay and benefits, provided they don’t make the employee take more leave than is medically necessary.
For example, employers could transfer an employee who wants to take leave in increments of 4 hours per day to a half-time job. They could also keep the employee in their original job on a part-time schedule, paying the same hourly rate as the employee's previous job and enjoying the same benefits.
Employers may not eliminate benefits that they otherwise wouldn’t give to part-time employees. They may, however, proportionately reduce benefits, such as vacation leave, where their normal practice is to base such benefits on the number of hours worked.
Employers may not transfer an employee to an alternative position to discourage them from taking FMLA leave or impose a hardship on the employee. They may not, for example:
- Transfer a white-collar employee to perform laborer's work,
- Reassign an employee working the day shift to the graveyard shift, or
- Reassign an employee working in the headquarters facility to a branch at a significant distance away from the employee's normal job location.
Job reinstatement
When employers may transfer employees to an alternative position, and those employees no longer need FMLA leave, employers must put them in the same or equivalent job as before.
Key to remember: Employers may transfer employees who take intermittent leave to an alternative position, but only if the leave is foreseeable.

NewsIndustry NewsIndustry NewsHR GeneralistFamily and Medical Leave Act (FMLA)Family and Medical Leave Act (FMLA)USAHR ManagementEnglishFocus AreaHuman Resources
2023-09-06T05:00:00Z
Appellate court sided with employee's (almost) 3-year-delayed FMLA claim
Back in October 2018, Laffon had a medical emergency and needed some time off under the federal Family and Medical Leave Act (FMLA).
Her leave lasted until November 15. Ten days after she returned to work, on November 26, her employer terminated her.
She sued, arguing that the employer retaliated against her because of her FMLA leave.
The catch? She didn't bring the suit until almost three years later.
No link between leave and termination
In court, the employer argued that there was no causal link between Laffon taking FMLA leave and her termination. Although the court documents aren't robust, they do reveal that the employer indicated that Laffon's allegations didn't show that her taking FMLA leave was a factor in the decision to terminate her. The documents showed only that the termination chronologically followed her leave.
The court agreed with the employer. It also agreed that Laffon failed to allege a willful violation of the FMLA, which would allow her to benefit from the FMLA's three-year statute of limitations.
Laffon appealed the case to the Ninth Circuit.
Statute of limitations
Under the FMLA, employees have two years from the date of the last event constituting the alleged violation for which they can bring a claim.
Those two years are extended to three years if the employer's actions were "willful." This means that an employee must show that the employer either knew or showed reckless disregard for whether its conduct violated the FMLA.
Ruling overturned
Fast forward to August 2023, when the Ninth Circuit reversed the lower court's decision. It indicated that, based on Laffon's amended complaint and liberally construing the law, her allegations establish that her leave was causally connected to her termination and that the employer's action (her termination) was willful.
Glymph v. CT Corporation Systems, No. 22-35735, Ninth Circuit Court of Appeals, August 22, 2023.
Key to remember: Terminating an employee soon after returning from FMLA leave is risky, unless there is a clear, well-documented, non-leave-related reason. Case documents did not show such a clear reason, which can also increase the risk of a willful finding. Employees have time to file claims, even years.
NewsLeaveTime offHR ManagementEnglishLeaveAssociate Benefits & CompensationNew YorkSafety & HealthChange NoticesConstruction SafetyChange NoticeGeneral Industry SafetyHR GeneralistAssociate RelationsFocus AreaHuman Resources
2026-04-20T05:00:00Z
New York paid family leave expanded
Effective date: January 1, 2027
This applies to: Employers with employees in New York
Description of change: New York Gov. Kathy Hochul signed a measure extending the New York paid family leave (PFL) benefits to certain construction employees.
Effective January 1, 2027, construction employees are eligible for PFL benefits if they were employed for at least 26 of the last 39 weeks by employers that are party to a collective bargaining agreement. Unpaid leave and vacation apply to the 26 weeks.
Construction employees are those who perform construction, demolition, reconstruction, excavation, rehabilitation, repairs, renovations, alterations, or improvements for multiple employers per a collective bargaining agreement.
View related state info: FMLA – New York

NewsIndustry NewsWellnessHR GeneralistIn-Depth ArticleWorkplace StressAssociate RelationsEnglishWellnessHR ManagementFocus AreaHuman ResourcesUSA
2026-04-16T05:00:00Z
Help employees spend wisely and stretch their paychecks
With inflation on the upswing and the cost of everyday items rising, your workers are likely looking for ways to stretch their money. Smart spending can help them do that.
April is Financial Literacy month and is the perfect time to share these money-saving tips:
- Track spending for a month so you understand where your money is going. Use information from credit card statements and your debit or checking account to see how much is spent on food, rent, clothing, transportation, and other items. Cash purchases can be tracked using receipts or a phone app.
- Add up your spending and consider where to cut back. Optional expenses such as eating out, streaming services, alcohol, entertainment, and gifts can be good places to trim.
- If you use a credit card, make payments on time to avoid late fees. Pay off the balance in full each month, or at least pay more than the minimum, to reduce finance charges.
- Curb impulse buys by waiting 24 hours before making a purchase that isn’t a necessity. Remove shopping apps from your phone and unfollow brands on social media that are too tempting.
- To cut back on your food bill, create a meal plan and a shopping list before going to the grocery store. Advanced planning will prevent you from buying more than you need. Look for recipes with common ingredients that can go a long way; plan to make extra so that you have leftovers and aren’t tempted to eat out as often. Inexpensive ingredients such as beans, rice, tortillas, pasta, potatoes, and lean meats can bolster numerous meals.
- At the grocery store, look for sales on frozen and canned fruits and vegetables. These options last longer and can be purchased in bulk when they’re on sale. In addition, savings from store-brand items can add up.
- Look for free fun. Take advantage of free concerts and museum days in your community. Visit the local library to see if passes for the zoo or other local attractions are available. Explore biking and hiking trails or stroll through the city.
Key to remember: Employers can help employees make the most of their pay with money-saving tips.

NewsIndustry NewsEnglishHR GeneralistIn-Depth ArticleUSAHR ManagementWellnessWellnessFocus AreaHuman Resources
Bring some green indoors to enhance job performance and employee well-being
Green is the color of March, as it signals the St. Patrick’s Day holiday as well as the emergence of spring. Did you know that bringing some green into your workplace can have benefits year-round?
A Harvard Business Review study found that bringing small pieces of nature into the workplace positively impacts employee performance and well-being.
The potted plant test
Researchers tested their theory by going into an office at night and placing potted plants by the desks of some employees. They placed office supplies on other employees’ desks.
The employees who were exposed to this small dose of nature displayed higher job performance, an increased desire to help, and enhanced creativity. No one was negatively impacted.
Bringing nature indoors
Live plants can’t be part of every work setting, but they’re not the only way to bring the benefits of nature indoors.
Nature-related elements can include:
- Windows with views of nature
- Indoor water features
- Murals of natural scenes
- Artificial plants or flowers
- Fish aquariums
Design features related to nature can also be more significant and included in building plans. For example, investing in landscaping designs outside office windows or having an indoor garden are ways to positively impact employees.
These options don’t have to break the bank or require a pot of gold, however. Simply allowing employees to place potted plants by their desks is an inexpensive way to enhance the workplace.
With a little luck, everyone will reap the benefits for having a little more green nearby.
Key to remember: Bringing natural touches to the workplace can have a positive impact on job performance, cooperation, and creativity.

NewsIn-Depth ArticleHR ManagementEnglishHuman ResourcesIndustry NewsHR PoliciesCompensationWage and HourWage and HourPolicies and ProceduresCompensationHR GeneralistMinimum WageFair Labor Standards Act (FLSA)Salary deductionsFocus AreaUSA
2023-08-22T05:00:00Z
Making employees pay for uniforms can be illegal
Last month, the U.S. Department of Labor (DOL) filed suit against a restaurant and its owner for back wages and liquidated damages for 26 employees.
An investigation by the DOL’s Wage and Hour Division (WHD) found multiple violations of the federal Fair Labor Standards Act (FLSA), including making illegal deductions from servers’ pay for uniforms, aprons, name tags, and lost items such as crackers and utensils, resulting in employees not earning minimum wage.
The WHD alleged that the company owes $75,402 in back wages to the 26 workers.
Limits on employee wage deductions
While restaurant profit margins might be thin and overhead expenses high, that doesn’t mean the business may dock employees’ pay for these kinds of costs. Many companies in the service industry have business-related expenses like the ones listed above, as well as:
- Cash drawer shortages,
- Tools required for work,
- Broken equipment,
- Lost supplies, and
- Customers who don’t pay their bills.
The FLSA does not, however, allow employers to make deductions from employee pay for any items which:
- Are considered primarily for the employer’s benefit or convenience, and
- Would reduce employee earnings below the minimum wage.
Case in point
If, for example, Bob’s Business requires Jo Employee to wear a uniform because it’s required by:
- Law,
- The nature of the business, or
- The employer,
The cost is considered Bob’s Business’ expense and not Jo’s.
If Bob wants Jo to wear specific clothing not worn outside of work, Bob will likely need to cover the cost. If Bob wants Jo to wear a general uniform like regular khakis and a polo shirt that can also be worn outside of work, Bob may require Jo to pay for it without considering the cost as coming out of Jo’s wages.
Otherwise, Bob may not require Jo or any employee to pay for uniforms that would bring their pay below the federal minimum wage.
How much do employees pay?
If an employer requires employees to bear the cost of work-related expenses, it may not reduce the employee’s wage below the federal minimum wage of $7.25 per hour. Nor may that cost cut into overtime compensation required by the FLSA.
If, for example, Jo was paid $7.75 per hour and worked 30 hours in the workweek, the maximum amount the employer could legally deduct from Jo’s wages would be $15 ($.50 X 30 hours).
Employers may spread out deductions for uniform or other costs over a period of paydays, as long as they’re compliant with the FLSA.
Key to remember: Improper wage deductions are on the WHD’s radar, especially in certain segments. The restaurant industry employs people who, in addition to being among the nation’s lowest paid workers, can also be vulnerable to wage theft because they might not know their rights and protections or be reluctant to exercise them. Therefore, the WHD takes these cases seriously.
Most Popular Highlights In Safety & Health
NewsMaterials Handling and StorageSafety & HealthChange NoticesChange NoticeMaritime SafetyOccupational Safety and Health Administration (OSHA), DOLFocus AreaEnglishMaterials Handling and StorageUSA
2026-04-17T05:00:00Z
OSHA Final Rule: House Falls in Marine Terminals
View final rule.
| Part 1917-Marine Terminals | ||
| Authority | Revised | View text |
| §1917.41 House falls. | ||
| Entire section | Removed and reserved | View text |
Previous Text
Part 1917-Marine Terminals
Authority: 33 U.S.C. 941; 29 U.S.C. 653, 655, 657; Secretary of Labor's Order No. 12-71 (36 FR 8754), 8-76 (41 FR 25059), 9-83 (48 FR 35736), 1-90 (55 FR 9033), 6-96 (62 FR 111), 3-2000 (65 FR 50017), 5-2002 (67 FR 65008), 5-2007 (72 FR 31160), 4-2010 (75 FR 55355), 1-2012 (77 FR 3912), 8-2020 (85 FR 58393), or 7-2025 (90 FR 27878), as applicable; and 29 CFR part 1911.
Sections 1917.28 and 1917.31 also issued under 5 U.S.C. 553. Section 1917.29 also issued under 49 U.S.C. 1801-1819 and 5 U.S.C. 553.

NewsIndustry NewsSafety and Health Programs and TrainingSafety & HealthConstruction SafetyGeneral Industry SafetySafety and Health Programs and TrainingIn-Depth ArticleEnglishFocus AreaUSA
2026-04-23T05:00:00Z
Got safety handbooks? We asked, you answered
Employee training, onboarding, ongoing reference … We asked the J. J. Keller Insights Community, a group of customers who share feedback about safety-related topics, how they use safety handbooks in their workplaces. These handbooks are purchased – not created in-house by the panelists or their company – and may focus on a specific topic, like personal protective equipment (PPE), or cover a broad range of environmental, health, and safety (EHS) topics.
More than 70 percent of respondents said they require new employees to review safety handbooks during onboarding. Another 58 percent said they use them for refresher or ongoing training, and several respondents mentioned using them for reference purposes.
Handbooks can play an important role in workplace safety and health programs. For new employees, they help set clear expectations before starting work, identify where to find vital safety information, and build safe habits early on. Handbooks also help ensure consistency by delivering the same core safety information to all employees regardless of department, shift, or trainer.
For supervisors and managers, safety handbooks are practical tools for leading toolbox talks, reinforcing or developing training materials, and addressing unsafe behaviors.
Shared versus individual handbooks
Nearly 60 percent of survey respondents bought one handbook (or a few) and shared them among employees, while 42 percent provided individual handbooks for each employee. Of those who purchased one or a few, they typically kept the handbooks in central or safety-related locations, such as:
- Main offices
- Safety or compliance offices
- EHS departments
- Classroom or training spaces
- Shared libraries near Safety Data Sheet binders or training areas
- Shop floors near work areas
Use in training programs
As mentioned, the majority of those surveyed said they use safety handbooks as part of new hire, ongoing, and refresher training. This includes the following uses:
- Building or supporting existing training programs
- Creating quizzes or review questions
- Supporting skills testing (e.g., forklift, ladder, PPE)
- Providing supplementary materials for:
- Toolbox talks
- OSHA 30 courses
- Job-specific trainings (e.g., load securement, bloodborne pathogens, Federal Motor Carrier Safety Regulations)
Additional survey feedback
Open-ended survey responses highlighted that some companies prefer visual presentations or digital formats over print publications, with some expressing concern that hard copy materials may quickly become outdated. Others said they use handbooks only as background reference for the EHS team and see a need to increase handbook use in their company.
Key to remember: Safety handbooks can serve as a core part of safety and health programs by giving employees and supervisors a shared reference for training conversations and expectations.

NewsIndustry NewsSafety & HealthGeneral Industry SafetyFood SafetySpecialized IndustriesIn-Depth ArticleEnglishFocus AreaUSA
2026-04-14T05:00:00Z
Training keeps safety on the menu in food manufacturing
Employees who handle food, clean food processing areas, or work around food-contact surfaces must be trained to understand the practices and procedures used to ensure food is safe to consume. Equally important, however, is the OSHA-related side of training aimed at keeping workers safe.
Busy production lines, heavy equipment, and frequent cleaning tasks can expose employees to numerous hazards. OSHA recently cited a commercial bakery in Illinois for repeatedly exposing employees to safety hazards and failing to train them in electrical work, implement safety-related practices, and enforce the use of personal protective equipment (PPE) when performing electrical work. Proposed penalties totaled over $300,000!
The following table highlights the Top 10 most frequently cited violations for food manufacturing in fiscal year 2025.
| Rank | 29 CFR | Title |
| 1 | 1910.147 | The control of hazardous energy (lockout/tagout) |
| 2 | 1910.212 | Machine guarding |
| 3 | 1910.1200 | Hazard communication |
| 4 | 1910.178 | Powered industrial trucks |
| 5 | 1910.305 | Wiring methods, components, and equipment for general use |
| 6 | 1910.303 | Wiring – general |
| 7 | 1910.219 | Mechanical power-transmission apparatus |
| 8 | 1910.132 | Personal protective equipment – general requirements |
| 9 | 1910.134 | Respiratory protection |
| 10 | 1910.28 | Duty to have fall protection and falling object protection |
| *Data reflect October 2024 through September 2025. | ||
Lockout/tagout. Employees who operate or perform service or maintenance on machines or equipment that must be locked out or tagged must be trained on the energy control procedures to be used. Training must be given prior to employees performing maintenance or service, as needed for employee proficiency, and when there are new or revised procedures. Energy control procedures must be reviewed annually to ensure they’re being followed and to correct any deficiencies.
Machine guarding. Exposed moving parts, frequent cleaning/changeovers, and close employee interaction with equipment make machine guarding critical. Although OSHA’s machine guarding regulations don’t specify training, the General Duty Clause requires that you provide a safe work environment. Employees should understand the purpose of machine guards, the types of guards used at your facility and the importance of not bypassing them, and who to contact if guards are missing or damaged.
Hazard communication (HazCom). Cleaning and sanitation of food production equipment is an integral component of food manufacturing. HazCom gives employees the right to know the hazards of the chemicals they’re exposed to. Paragraph (h) of 1910.1200 outlines the standard’s information and training requirements related to chemical hazards.
Powered industrial trucks (PITs). Congested production areas and warehouses, tight aisles, and limited visibility can pose hazards for both forklift drivers and nearby employees. PIT operators must be trained and evaluated according to the criteria at 1910.178(l)(1) and you must maintain certification that this was completed.
Electrical. In food manufacturing environments, electrical systems are often exposed to moisture, washdowns, chemicals, vibration, and temperature extremes, which increases the potential for hazards. Under 1910.332, training must be provided to employees who are exposed to electrical shock and those who work on or near exposed energized parts.
Personal protective equipment (PPE). In food manufacturing, PPE often serves the dual purpose of protecting workers from injury and protecting food from contamination. Employees must be trained to understand when PPE is necessary; what PPE is necessary; how to properly don, doff, remove, adjust, and wear PPE; its limitations; and its proper care, maintenance, useful life, and disposal.
Respiratory protection. Respirators may be needed during ingredient handling, sanitation, or maintenance processes. OSHA’s regulation at 1910.134 requires training for employees who wear respirators. Training must be conducted before employees use a respirator, repeated annually, and as often as necessary to ensure safe use.
Duty to have fall protection and falling object protection. Food manufacturing facilities often have fall-risk areas such as mezzanines or catwalks above production lines, elevated platforms for mixers and other equipment, and conveyor crossings. Employees who use fall protection or are otherwise exposed to fall hazards must be trained under the requirements at 1910.30. Training must be conducted by a qualified person, as defined at 1910.21(b).
Key to remember: Food manufacturing can expose employees to numerous hazards. Workplace safety training plays a key role in helping employees recognize hazards, work safely, and protect both themselves and the product.

NewsExcavation Hazard IdentificationIndustry NewsIndustry NewsExcavation InspectionsSafety & HealthConstruction SafetyExcavationsOccupational Safety and Health Administration (OSHA), DOLUSAEnglishFocus AreaCompetent Person
2025-08-05T05:00:00Z
OSHA urges employers to protect workers from trenching, excavation hazards
Following a series of trench collapses in the Midwest, OSHA is urging employers to take steps to protect workers from trenching and excavation hazards. These hazards are preventable when appropriate protections are used; employers must follow the regulations at 29 CFR 1926 Subpart P.
Workers should follow these safe work practices to protect themselves from hazards:
- Test the soil at every worksite before work begins;
- Never enter a trench unless it has been properly inspected by a competent person;
- Ensure there is a safe way to enter and exit a trench; and
- Keep materials away from the edge of a trench.
Additionally, trench collapses can be prevented by doing the following:
- SLOPE or bench trench walls at an angle;
- SHORE trench walls with supports, such as aluminum hydraulic, to prevent soil movement; and
- SHIELD trench walls with trench boxes.
Additional information about trenching and excavation hazards and solutions can be found on OSHA’s Trenching and Excavation webpage.

NewsIndustry NewsHeat and Cold ExposureSafety & HealthConstruction SafetyGeneral Industry SafetyAgriculture SafetyMaritime SafetyIn-Depth ArticleExtreme Temperature PreparationEnglishMine SafetyHeat StressFocus AreaUSA
2026-04-20T05:00:00Z
How heat becomes fatal
Imagine a workplace where the real danger is something you can’t even see. Extreme temperatures don’t just make workers uncomfortable; they can silently push the human body past its limits, triggering a deadly chain reaction. When cooling mechanisms fail, organs shut down, and what starts as simple dehydration can spiral into heatstroke which kills more workers than many realize. Understanding how heat becomes lethal is the first step toward preventing tragedy.
What’s happening to the body?
No one is immune from extreme heat when controls are lacking. While some workers are more vulnerable (e.g., older workers, seasonal workers, or those not acclimatized to the heat), the human body still reacts to heat when temperatures soar.
As temperatures rise, the heart pumps harder to maintain core body temperature. Blood helps millions of sweat glands in the body to send moisture to the skin’s surface, allowing heat to evaporate into the air. This process is meant to cool the body. However, when it’s extremely hot and humid, the sweat glands just can’t keep up, and cooling becomes impossible without the additional help of cooling aids.
Humidity, or moisture in the air, prevents sweat from evaporating off the skin. This keeps the body from cooling effectively which can create overheating. As the body continues to overheat, it sweats more, which results in reduced blood volume and dehydration. This can quickly lead to two additional negative consequences:
- Blood pressure drops. The heart is required to pump more to maintain pressure so blood can reach vital organs. When blood can’t effectively reach the lungs or brain, the body begins to shut down quickly and cognitive abilities can decrease rapidly or cease altogether.
- Dehydration ensues. Typically, by the time you feel thirsty, you are already dehydrated. Continued fluid loss means the body has nothing to create sweat with to send to the skins surface.
A lack of blood flow to vital organs, along with dehydration, lead to poor decision-making and impaired judgment, which can result in serious workplace incidents; some of which can be fatal.
What are the warning signs?
The body will tell you when it’s in trouble. Heat exhaustion warning signs begin with symptoms such as:
- Excessive sweating;
- Cool, pale, or clammy skin;
- Light-headedness from a weak pulse;
- Nausea or vomiting;
- Muscle cramps; and /or
- Unusual irritability.
These are tell-tale signs that your body is dehydrated and starting to lose the ability to self-cool. If protective measures like hydration, rest, and external cooling aren’t taken right away, heat exhaustion can quickly become heat stroke. This can happen within minutes, creating a quick downward spiral to disorientation, unconsciousness, organ shutdown, and heart failure.
How can killer heat be stopped?
Heat can be deadly, but it doesn’t have to be. By applying these simple controls and safe work practices, you can help protect workers from life-threatening heat exposure:
- Water: Ensure workers consume at least 1 quart of suitably cool water per hour (or 8 oz every 15 minutes) during excessive heat. Avoiding caffeinated or sugary drinks will also help ward off dehydration.
- Rest: Encourage workers to take frequent breaks from the heat in artificially or naturally shaded areas, where there is air movement, or in an air-conditioned area.. Ensure break areas are as close as possible to the work area and are sufficient enough to hydrate, remove PPE, and cool down.
- Shade: Provide shade areas (e.g., tents), fans, air-conditioning, or cooling stations.
- Acclimatization: Gradually increase employee exposure over time so the body isn’t more stressed in the heat, then monitor workers closely during this time.
- Administrative controls: Plan more intensive work activities for cooler parts of the day, implement a buddy system for monitoring workers, and rotate workers so frequent breaks are possible. Monitor weather conditions so work can be adjusted accordingly.
- Clothing and PPE: Provide hats and cooling gear for workers and encourage them to wear lightweight, loose-fitting, and light-colored clothing.
- Training: Train workers to understand dangerous temperatures and how to recognize and respond to symptoms of heat stress.
- Be prepared! Implement a heat injury and illness prevention plan that includes quick medical access and care.
Keys to remember: Heat becomes lethal when the body’s cooling mechanisms fail, allowing core temperature to rise beyond control. Prevention methods are essential for halting heat stress that can trigger widespread cellular damage, inflammation, and organ failure.

NewsIndustry NewsSafety & HealthConstruction SafetyGeneral Industry SafetyWalking Working SurfacesIn-Depth ArticleLaddersEnglishFocus AreaUSA
2026-04-22T05:00:00Z
Ladders, familiar work, serious risks
Ladder-related standards consistently rank among OSHA’s top 10 most cited violations. Every year, serious injuries continue to occur, not because ladders are unsafe, but because they’re used in ways people don’t recognize them as risky.
Preventing ladder incidents starts with recognizing when everyday tasks introduce risk and making deliberate choices to use, position, and reassess ladders before unsafe habits take hold.
Ladders feel safe, until they’re not
Ladders don’t usually trigger a sense of risk because they’re seen as a part of everyday work. When tasks feel quick and familiar, people don’t always stop reassessing the setup. That’s how unsafe ladder habits with big consequences can develop, including:
- standing on the top step “just for a second;”
- reaching too far instead of climbing down;
- using whatever ladder is closest, not the right one; and
- skipping ladder inspections because “it worked last time.”
Ladder safety isn’t going away, and that’s not a bad thing
If ladder safety feels like a repeat conversation, that’s because the same risks keep showing up. New employees are hired; facilities and equipment changes, and old habits stick around longer than they should. Even experienced workers fall into this trap. Familiar tasks start to invite rushing. Rushing leads to shortcuts, and shortcuts are where ladder injuries happen.
Emphasis must be placed on recognizing the risk before the climb starts. This means knowing when a ladder is the wrong choice, repositioning is safer than reaching, and when a quick task deserves the same setup as a longer one.
Most incidents don’t start with bad intentions. They start with “just this once” decisions, one more rung, one quick reach, one skipped check. Effective ladder safety training is about breaking routines and refocusing attention on the decisions that make ladder work safer.
Routine work, repeat injuries
Ladder injuries follow a familiar pattern. They don’t usually come from unusual jobs or unexpected hazards, and they happen during everyday tasks that feel common. Injury reports often look the same, such as short tasks, quick setups, and decisions made under time pressure. The ladder didn’t fail. The setup and the decisions around it did.
Injury data from OSHA and the Bureau of Labor Statistics (BLS) consistently point to the same causes. That’s why the same types of ladder injuries keep occurring repeatedly, not because the hazards are unknown, but because routine work makes those hazards easier to overlook. These reasons include:
- people underestimate the risk because ladders feel familiar;
- jobs feel “too small” to stop and reset the ladder;
- time pressure encourages leaning, rushing, and overreaching; and
- experience leads to comfort, and comfort leads to shortcuts.
The rules are written in injuries
OSHA ladder requirements are built around real injury trends and are based on decades of injury data. Falls from ladders remain one of the leading causes of workplace injuries, which is why OSHA keeps ladders near the top of its enforcement priorities year after year:
OSHA 29 CFR 1910.23 defines how ladders are intended to be used, specifically prohibiting practices such as standing on the top step of a stepladder, using ladders for purposes they were not designed for, and climbing ladders that have not been inspected. These requirements exist because improper use, poor setup, and skipped inspections consistently show up in ladder fall investigations.
OSHA 29 CFR 1910.30 reinforces that preventing ladder injuries depends on training employees to recognize hazards before they climb, understand proper ladder selection and positioning, and know when a ladder is not the right tool for the task. Together, these standards emphasize that ladder injuries are not random events, they are predictable outcomes of routine decisions made during everyday work.
Small choices make a big difference
Ladder safety isn’t only about compliance. Incidents develop from a series of small, moment to moment decisions made during routine work. These choices made daily either reduce risk or quietly add to it. Ladder injuries can be avoided by taking the time to make simple improvements including:
- inspecting and securing the ladder,
- climbing down and repositioning,
- selecting the proper ladder for the task, and
- stopping when the ladder no longer feels stable or safe.
Key to remember: Take the time to choose safer setups, stay alert, and prevent routine decisions from turning into preventable injuries. When employees choose the correct ladder, reposition instead of reaching, and inspect before use, the risk of ladder injuries falls, not your employees.
Saved to my EVENT CALENDAR!
View your saved links by clicking the arrow next to your profile picture located in the header. Then, click “My Activity” to view the Event Calendar on your Activity page.
OK
J. J. Keller is the trusted source for DOT / Transportation, OSHA / Workplace Safety, Human Resources, Construction Safety and Hazmat / Hazardous Materials regulation compliance products and services. J. J. Keller helps you increase safety awareness, reduce risk, follow best practices, improve safety training, and stay current with changing regulations.
Copyright 2026 J. J. Keller & Associate, Inc. For re-use options please contact copyright@jjkeller.com or call 800-558-5011.